

Question
Create a Histogram program in java I've gotten the code to work to the point of displaying the statistics, the histogram data and the vertical
Create a Histogram program in java
I've gotten the code to work to the point of displaying the statistics, the histogram data and the vertical column for test run 1. I am stuck on how to display the horizontal row histogram and the summary report. I need the code that builds these two additional outputs. The working code that produces PARTIAL output is at the bottom of the post.
1 .Create two Java program files named Histogram.java and HistogramTester.java.
2.In Histogram.java, implement a class for the Histogram object described below in the test output. Use the HistogramTester.java file to test your object in development. You do not need user input; simply hardcode the values using parameters. For structure, this assignment will leave open what to include as attributes or methods, as long as it has both and they are used properly. Break the problem up into tasks that would be well-suited for a single method.
3.Within the tester, enter some user-entered examples that will give the results of Test Run 1, while Test Run 2 will make use of the Die object to populate the data.
4.Upon completion, your program should execute exactly like the program test run (output). Test your program several times with different datasets, to make sure your program works correctly.
Code for Die Object refenced in step 3
import java.util.*; public class Die { //Object attributes private String name; private int numSides; private int currentValue; private Random generator = new Random(); public Die() { this.numSides = 0; this.currentValue = 0; } public Die (int numSides_) { numSides = numSides_; currentValue = 0; } public int getMumSides() { return numSides; } public void getCurrentValue (int currentValue_) { this.currentValue = currentValue_; }
public int roll() { this.currentValue = generator.nextInt(numSides) + 1; return currentValue; } public String toString() { String result=""; result += Integer.toString(currentValue); return result; } }
Output
test run 1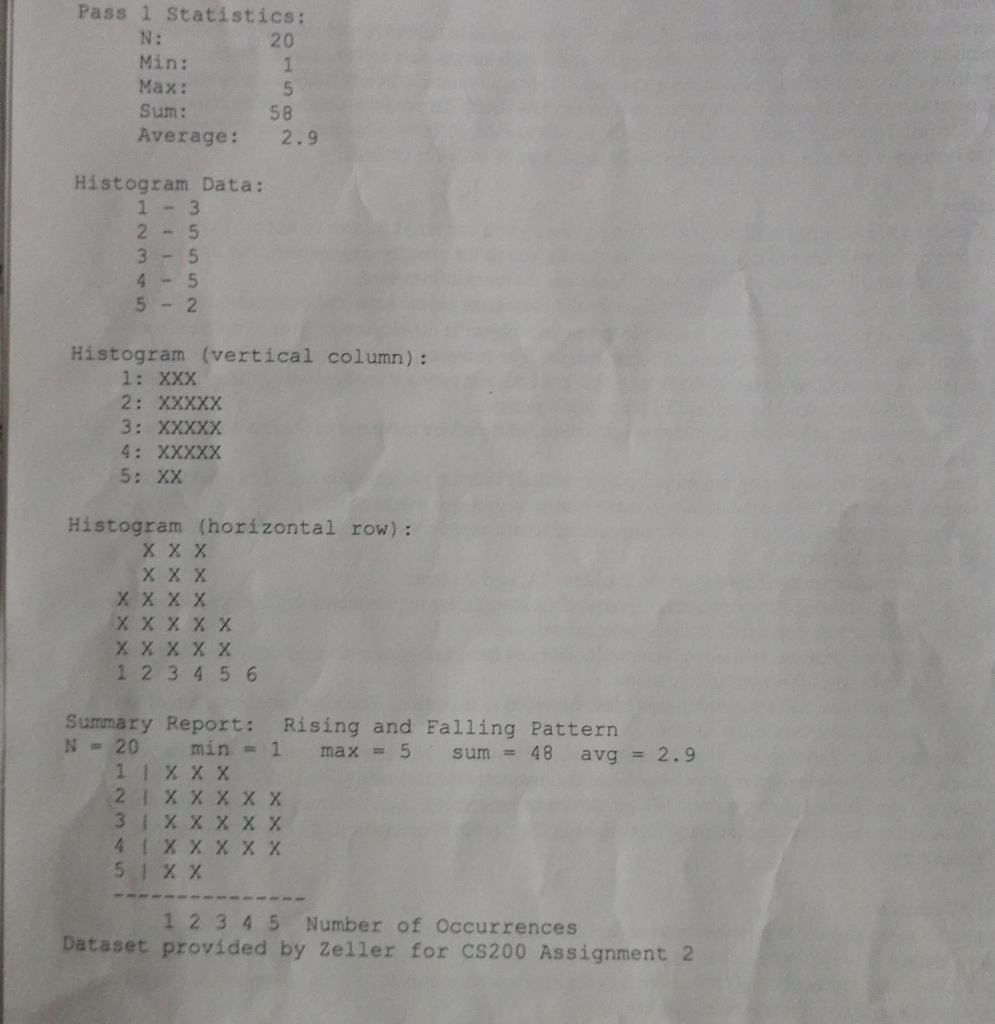
test run 2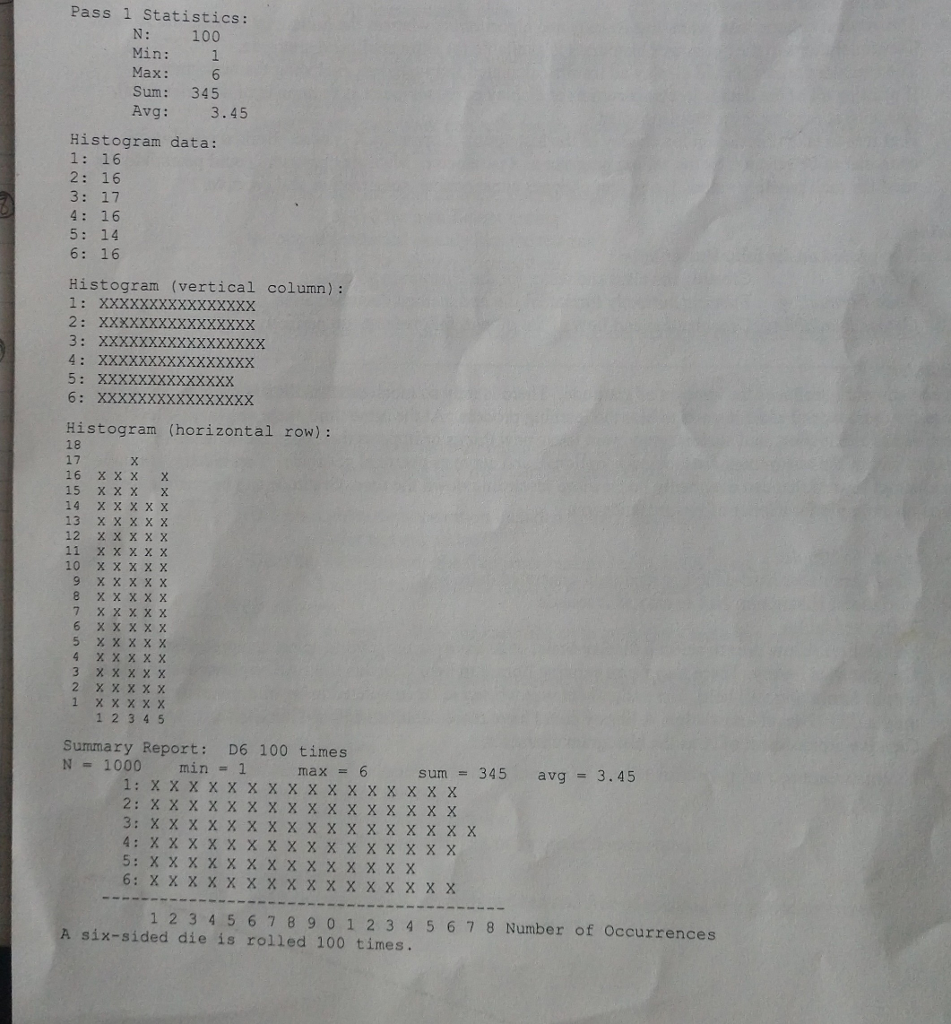
Histogram.java
import java.util.*; public class Histogram { String histogramName; int maximum; int[] count; public Histogram(String histogramName_, int maximum_) { this.histogramName = histogramName_; this.maximum = maximum_; this.count = new int[maximum_+1]; } public int addNumber(int numbers) { count[numbers]++; return numbers; } public String toString() { String result = histogramName + " "; for (int index = 1; index
HistogramTester.java
import java.util.*; public class HistogramTester { public static void main (String[] args) { List testRunOneValues = new ArrayList(); double testRunOneSum = 0; double testRunOneAvg;
Histogram histogram = new Histogram ("Histogram (vertical column):", 5); testRunOneValues.add(histogram.addNumber(1)); testRunOneValues.add(histogram.addNumber(2)); testRunOneValues.add(histogram.addNumber(3)); testRunOneValues.add(histogram.addNumber(4)); testRunOneValues.add(histogram.addNumber(5)); testRunOneValues.add(histogram.addNumber(4)); testRunOneValues.add(histogram.addNumber(3)); testRunOneValues.add(histogram.addNumber(2)); testRunOneValues.add(histogram.addNumber(1)); testRunOneValues.add(histogram.addNumber(2)); testRunOneValues.add(histogram.addNumber(3)); testRunOneValues.add(histogram.addNumber(4)); testRunOneValues.add(histogram.addNumber(5)); testRunOneValues.add(histogram.addNumber(4)); testRunOneValues.add(histogram.addNumber(3)); testRunOneValues.add(histogram.addNumber(2)); testRunOneValues.add(histogram.addNumber(1)); testRunOneValues.add(histogram.addNumber(2)); testRunOneValues.add(histogram.addNumber(3)); testRunOneValues.add(histogram.addNumber(4)); double minimum=Collections.min(testRunOneValues); double maximum=Collections.max(testRunOneValues); for(int i = 0; i Pass 1 Statistics: 20 N: Min: Max: Sum: Average: 2.9 58 Histogram Data: 1-3 2 5 3-5 5 2 Histogram (vertical column) : 1: XXX 5: xx Histogram (horizontal row) : x x X x x x X XxxX X X x X X X 1 2 3 45 6 Summary Report: Rising and Falling Pattern N= 20 min= 1 max= 5 sum= 48 avg= 2.9 31X X x XX 41xxX x x 1 23 45 Number of Occurrences Dataset provided by Zeller for cs200 Assignment 2
Step by Step Solution
There are 3 Steps involved in it
Step: 1

Get Instant Access to Expert-Tailored Solutions
See step-by-step solutions with expert insights and AI powered tools for academic success
Step: 2

Step: 3
Ace Your Homework with AI
Get the answers you need in no time with our AI-driven, step-by-step assistance
Get Started
Database Design And Relational Theory Normal Forms And All That Jazz
Authors: Chris Date
1st Edition
1449328016, 978-1449328016