Answered step by step
Verified Expert Solution
Question
1 Approved Answer
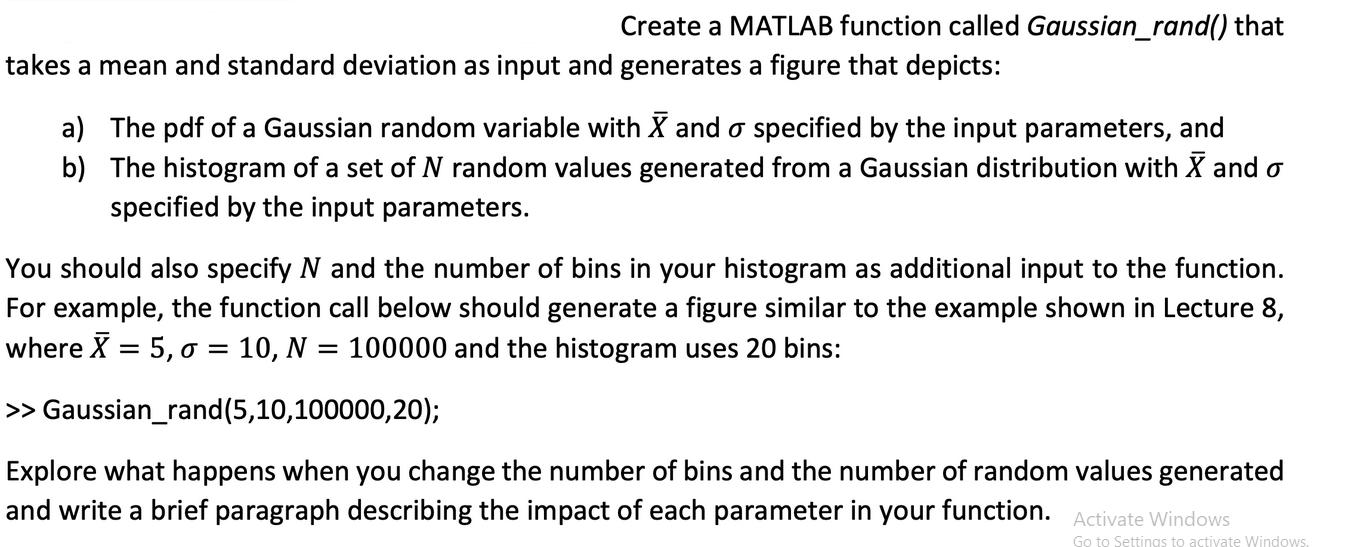
Create a MATLAB function called Gaussian_rand() that takes a mean and standard deviation as input and generates a figure that depicts: a) The pdf

Create a MATLAB function called Gaussian_rand() that takes a mean and standard deviation as input and generates a figure that depicts: a) The pdf of a Gaussian random variable with X and specified by the input parameters, and b) The histogram of a set of N random values generated from a Gaussian distribution with X and specified by the input parameters. You should also specify N and the number of bins in your histogram as additional input to the function. For example, the function call below should generate a figure similar to the example shown in Lecture 8, where x = 5, = 10, N = 100000 and the histogram uses 20 bins: >> Gaussian_rand (5,10,100000,20); Explore what happens when you change the number of bins and the number of random values generated and write a brief paragraph describing the impact of each parameter in your function. Activate Windows Go to Settings to activate Windows.
Step by Step Solution
There are 3 Steps involved in it
Step: 1
Here is a stepbystep MATLAB code that accomplishes this task function Gaussianrandmean stddev N numbins Generate N random values from a Gaussian distr...
Get Instant Access to Expert-Tailored Solutions
See step-by-step solutions with expert insights and AI powered tools for academic success
Step: 2

Step: 3

Ace Your Homework with AI
Get the answers you need in no time with our AI-driven, step-by-step assistance
Get Started


