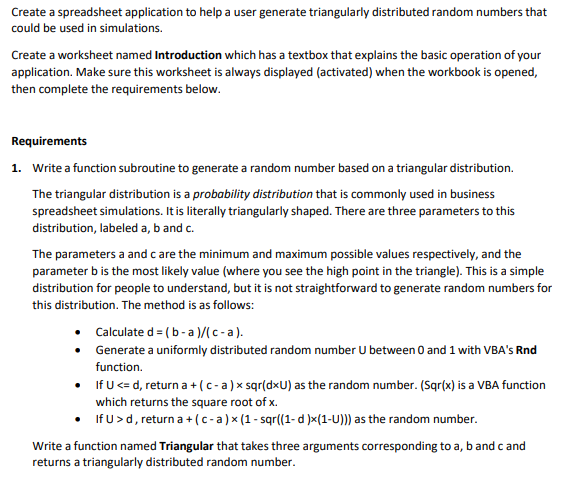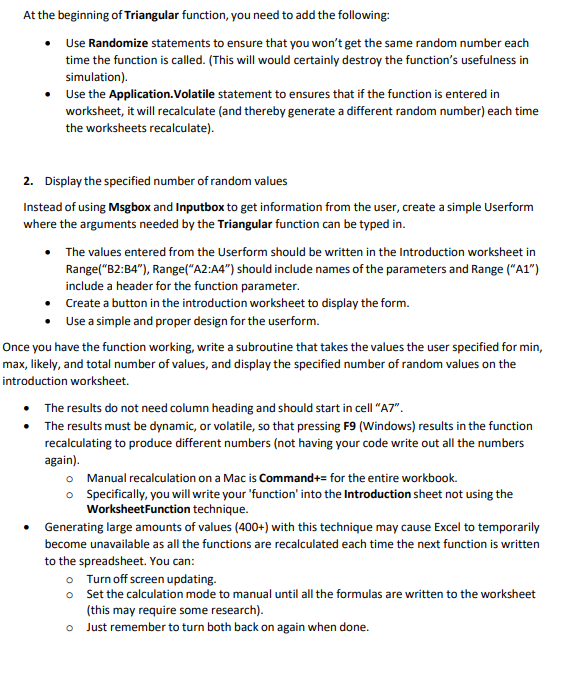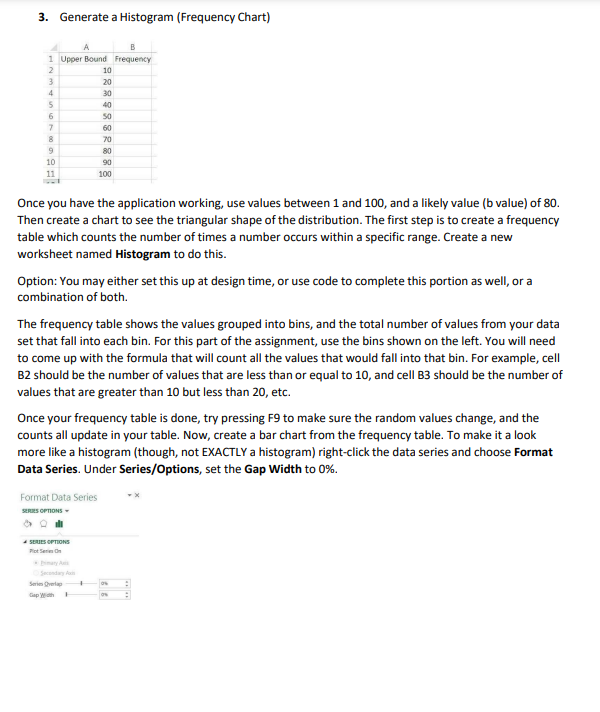


Create a spreadsheet application to help a user generate triangularly distributed random numbers that could be used in simulations. Create a worksheet named Introduction which has a textbox that explains the basic operation of your application. Make sure this worksheet is always displayed (activated) when the workbook is opened, then complete the requirements below. Requirements 1. Write a function subroutine to generate a random number based on a triangular distribution. The triangular distribution is a probability distribution that is commonly used in business spreadsheet simulations. It is literally triangularly shaped. There are three parameters to this distribution, labeled a,b and c. The parameters a and c are the minimum and maximum possible values respectively, and the parameter b is the most likely value (where you see the high point in the triangle). This is a simple distribution for people to understand, but it is not straightforward to generate random numbers for this distribution. The method is as follows: - Calculate d=(ba)/(ca). - Generate a uniformly distributed random number U between 0 and 1 with VBA's Rnd function. - If Ud, return a+(ca)(1sqr((1d)(1U))) as the random number. Write a function named Triangular that takes three arguments corresponding to a,b and c and returns a triangularly distributed random number. At the beginning of Triangular function, you need to add the following: - Use Randomize statements to ensure that you won't get the same random number each time the function is called. (This will would certainly destroy the function's usefulness in simulation). - Use the Application.Volatile statement to ensures that if the function is entered in worksheet, it will recalculate (and thereby generate a different random number) each time the worksheets recalculate). 2. Display the specified number of random values Instead of using Msgbox and Inputbox to get information from the user, create a simple Userform where the arguments needed by the Triangular function can be typed in. - The values entered from the Userform should be written in the Introduction worksheet in Range( BB2:B4", Range("A2:A4") should include names of the parameters and Range ( "A1") include a header for the function parameter. - Create a button in the introduction worksheet to display the form. - Use a simple and proper design for the userform. Once you have the function working, write a subroutine that takes the values the user specified for min, max, likely, and total number of values, and display the specified number of random values on the introduction worksheet. - The results do not need column heading and should start in cell "A7". - The results must be dynamic, or volatile, so that pressing F9 (Windows) results in the function recalculating to produce different numbers (not having your code write out all the numbers again). Manual recalculation on a Mac is Command+= for the entire workbook. Specifically, you will write your 'function' into the Introduction sheet not using the WorksheetFunction technique. - Generating large amounts of values (400+) with this technique may cause Excel to temporarily become unavailable as all the functions are recalculated each time the next function is written to the spreadsheet. You can: Turn off screen updating. Set the calculation mode to manual until all the formulas are written to the worksheet (this may require some research). Just remember to turn both back on again when done. 3. Generate a Histogram (Frequency Chart) Once you have the application working, use values between 1 and 100 , and a likely value ( b value) of 80 . Then create a chart to see the triangular shape of the distribution. The first step is to create a frequency table which counts the number of times a number occurs within a specific range. Create a new worksheet named Histogram to do this. Option: You may either set this up at design time, or use code to complete this portion as well, or a combination of both. The frequency table shows the values grouped into bins, and the total number of values from your data set that fall into each bin. For this part of the assignment, use the bins shown on the left. You will need to come up with the formula that will count all the values that would fall into that bin. For example, cell B2 should be the number of values that are less than or equal to 10 , and cell B3 should be the number of values that are greater than 10 but less than 20 , etc. Once your frequency table is done, try pressing F9 to make sure the random values change, and the counts all update in your table. Now, create a bar chart from the frequency table. To make it a look more like a histogram (though, not EXACTLY a histogram) right-click the data series and choose Format Data Series. Under Series/Options, set the Gap Width to 0\%


