Question
Create a subplot that shows 4 histograms fig, ax = plt.subplots (nrows=2, ncols=2, figsize=(10, 6)) sepal length = data[:, 1] sepal_width = data[:, 2]

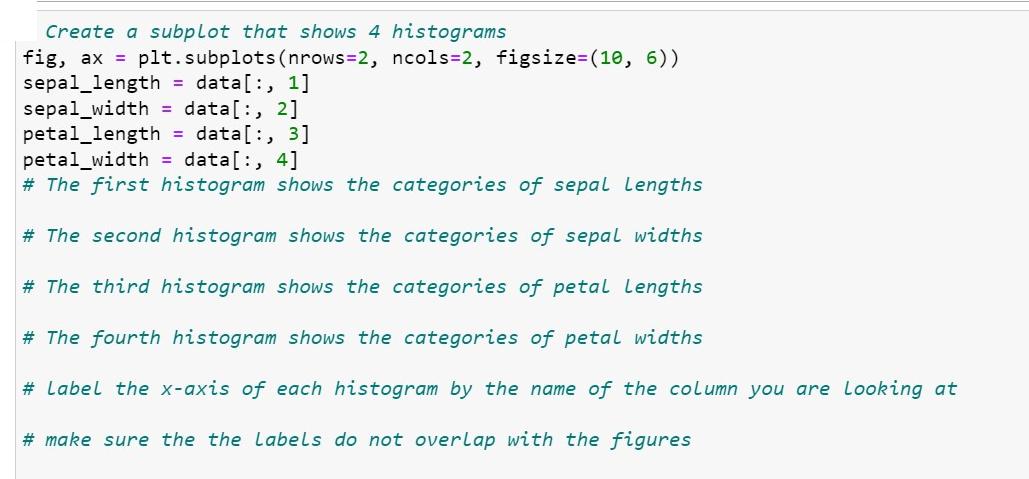
Create a subplot that shows 4 histograms fig, ax = plt.subplots (nrows=2, ncols=2, figsize=(10, 6)) sepal length = data[:, 1] sepal_width = data[:, 2] petal_length = data[:, 3] petal_width = data[:, 4] # The first histogram shows the categories of sepal Lengths # The second histogram shows the categories of sepal widths # The third histogram shows the categories of petal Lengths # The fourth histogram shows the categories of petal widths # Label the x-axis of each histogram by the name of the column you are looking at # make sure the the Labels do not overlap with the figures
Step by Step Solution
There are 3 Steps involved in it
Step: 1

Get Instant Access to Expert-Tailored Solutions
See step-by-step solutions with expert insights and AI powered tools for academic success
Step: 2

Step: 3

Ace Your Homework with AI
Get the answers you need in no time with our AI-driven, step-by-step assistance
Get StartedRecommended Textbook for
Elementary Statistics
Authors: Robert R. Johnson, Patricia J. Kuby
11th Edition
978-053873350, 9781133169321, 538733500, 1133169325, 978-0538733502
Students also viewed these Databases questions
Question
Answered: 1 week ago
Question
Answered: 1 week ago
Question
Answered: 1 week ago
Question
Answered: 1 week ago
Question
Answered: 1 week ago
Question
Answered: 1 week ago
Question
Answered: 1 week ago
Question
Answered: 1 week ago
Question
Answered: 1 week ago
Question
Answered: 1 week ago
Question
Answered: 1 week ago
Question
Answered: 1 week ago
Question
Answered: 1 week ago
Question
Answered: 1 week ago
Question
Answered: 1 week ago
Question
Answered: 1 week ago
Question
Answered: 1 week ago
Question
Answered: 1 week ago
Question
Answered: 1 week ago
Question
Answered: 1 week ago
Question
Answered: 1 week ago
Question
Answered: 1 week ago
View Answer in SolutionInn App


