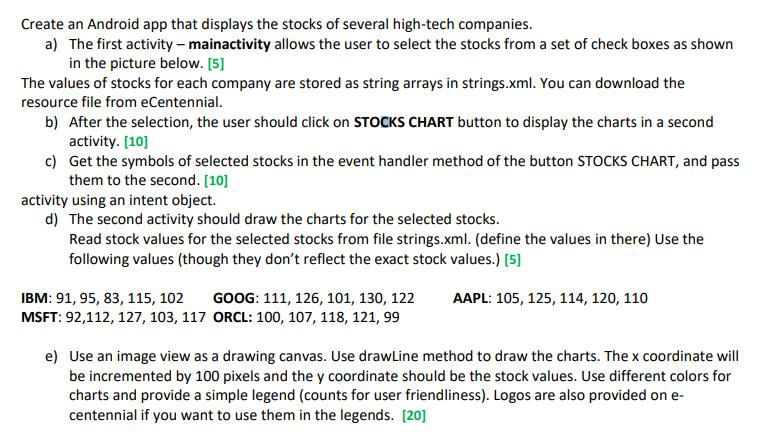
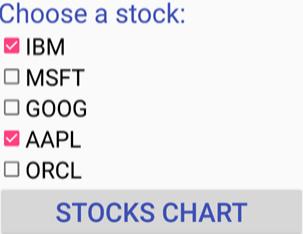
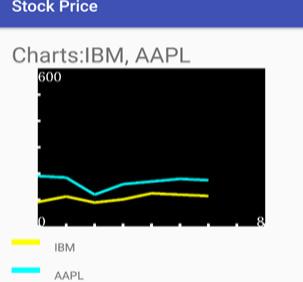
Create an Android app that displays the stocks of several high-tech companies. a) The first activity - mainactivity allows the user to select the stocks from a set of check boxes as shown in the picture below. [5] The values of stocks for each company are stored as string arrays in strings.xml. You can download the resource file from eCentennial. b) After the selection, the user should click on STOCKS CHART button to display the charts in a second activity. [10] c) Get the symbols of selected stocks in the event handler method of the button STOCKS CHART, and pass them to the second. [10] activity using an intent object. d) The second activity should draw the charts for the selected stocks. Read stock values for the selected stocks from file strings.xml. (define the values in there) Use the following values (though they don't reflect the exact stock values.) [5] IBM: 91, 95, 83, 115, 102 GOOG: 111, 126, 101, 130, 122 MSFT: 92,112, 127, 103, 117 ORCL: 100, 107, 118, 121, 99 AAPL: 105, 125, 114, 120, 110 e) Use an image view as a drawing canvas. Use drawLine method to draw the charts. The x coordinate will be incremented by 100 pixels and the y coordinate should be the stock values. Use different colors for charts and provide a simple legend (counts for user friendliness). Logos are also provided on e- centennial if you want to use them in the legends. [20] Choose a stock: IBM OMSFT O GOOG AAPL ORCL STOCKS CHART Create an Android app that displays the stocks of several high-tech companies. a) The first activity - mainactivity allows the user to select the stocks from a set of check boxes as shown in the picture below. [5] The values of stocks for each company are stored as string arrays in strings.xml. You can download the resource file from eCentennial. b) After the selection, the user should click on STOCKS CHART button to display the charts in a second activity. [10] c) Get the symbols of selected stocks in the event handler method of the button STOCKS CHART, and pass them to the second. [10] activity using an intent object. d) The second activity should draw the charts for the selected stocks. Read stock values for the selected stocks from file strings.xml. (define the values in there) Use the following values (though they don't reflect the exact stock values.) [5] IBM: 91, 95, 83, 115, 102 GOOG: 111, 126, 101, 130, 122 MSFT: 92,112, 127, 103, 117 ORCL: 100, 107, 118, 121, 99 AAPL: 105, 125, 114, 120, 110 e) Use an image view as a drawing canvas. Use drawLine method to draw the charts. The x coordinate will be incremented by 100 pixels and the y coordinate should be the stock values. Use different colors for charts and provide a simple legend (counts for user friendliness). Logos are also provided on e- centennial if you want to use them in the legends. [20] Choose a stock: IBM OMSFT O GOOG AAPL ORCL STOCKS CHART