Answered step by step
Verified Expert Solution
Question
1 Approved Answer
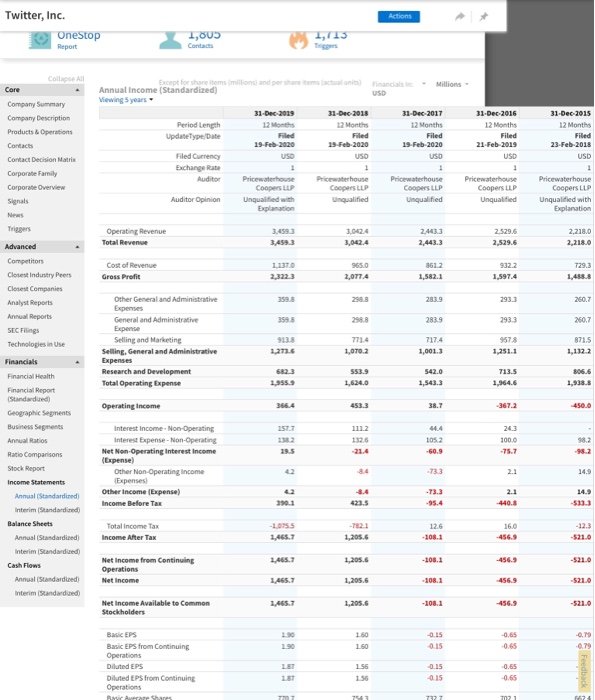
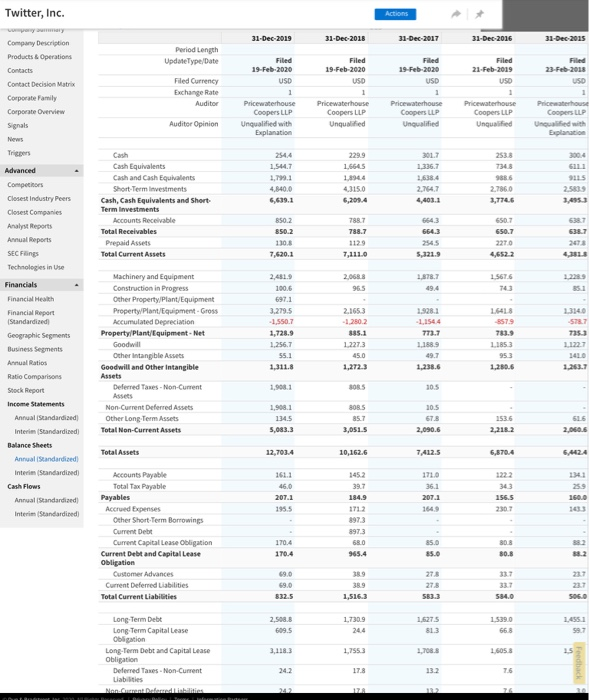
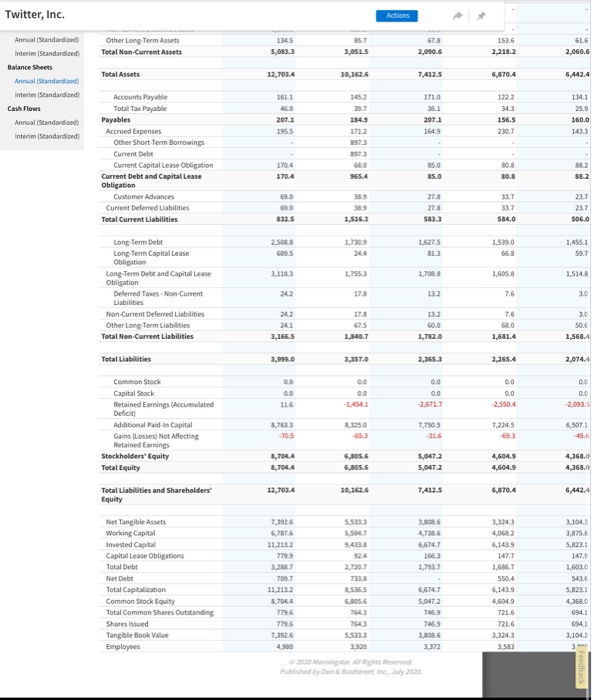
Create Common Size Analysis (i.e., vertical financial analysis) for Facebook and Twitter This should be a providing an Income Statement Common Size Analysis (CSA) for
Create Common Size Analysis (i.e., vertical financial analysis) for Facebook and Twitter
This should be a providing an Income Statement Common Size Analysis (CSA) for Facebook and one key competitor Twitter for the past 5 years.
Create Trending Analysis (i.e., horizontal financial analysis): This should be a providing an Income Statement Trending Analysis for Facebook and key competitor Twitter for the past 5 years.
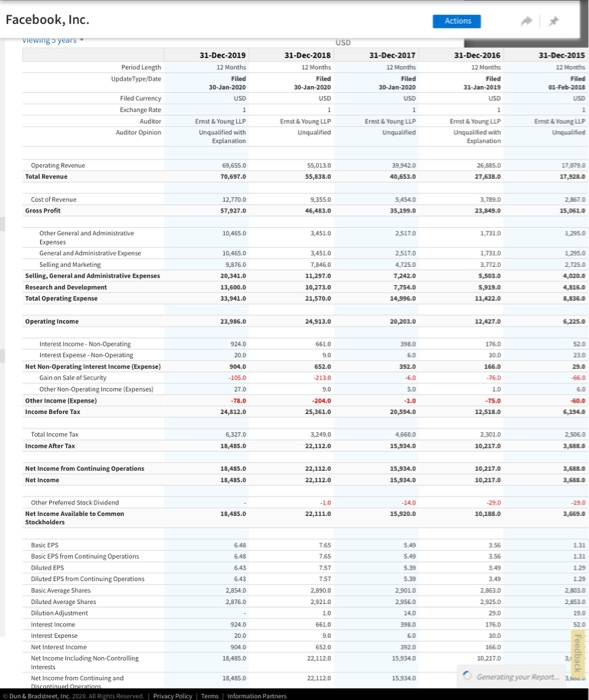
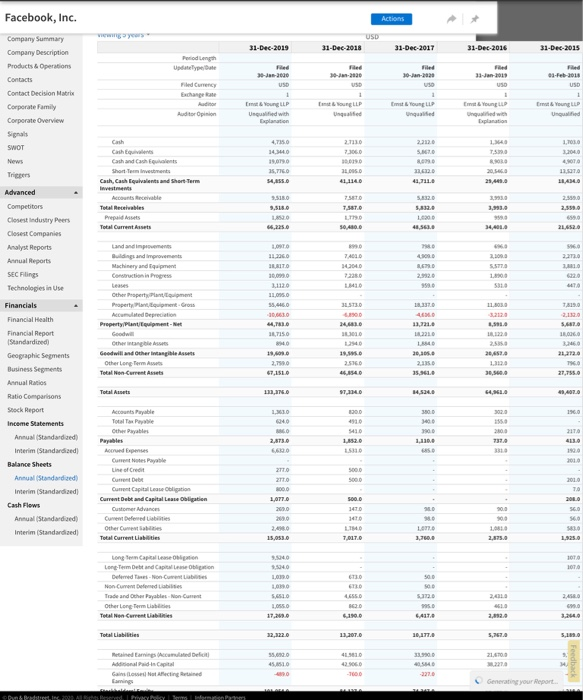
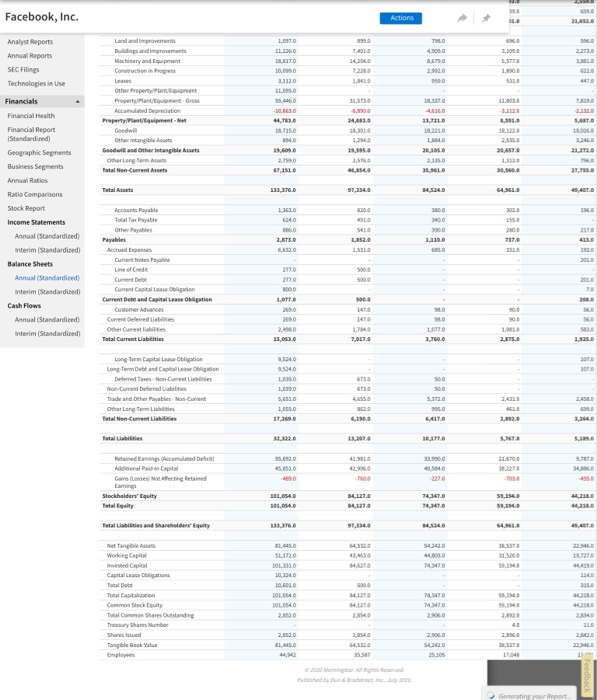
Facebook, Inc. viewing years Operating Revenue Total Revenue Cost of Revenue Gross Profit Operating income Other General and Administrative Expenses General and Administrative Expense Selling and Marketing Selling, General and Administrative Expenses Research and Development Total Operating Expense Period Length UpdateType/Date Interest Income-Non-Operating Interest Expense-Non-Operating Net Non-Operating Interest Income (Expense) Gain on Sale of Security Other Income (Expense) Income Before Tax Filed Currency Exchange Rate Auditor Auditor Opinion Other Non-Operating Income (Expenses) Total Income Tax Income After Tax Net Income from Continuing Operations Net Income Other Preferred Stock Dividend Net Income Available to Common Stockholders Diluted Average Shares Dilution Adjustment Interest income Interest Expense Basic EPS Basic EPS from Continuing Operations Diluted EPS Diluted EPS from Continuing Operations Basic Average Shares Net Interest Income Net Income Including Non-Controlling Interests 31-Dec-2019 12 Months Filed 30-Jan-2020 USD 1 Ernst & Young LLP Unqualified with Explanation 69,655.0 70,697.0 12,770.0 $7,927.0 10,465.0 10,465.0 9,876.0 20,341.0 13,600.0 33,941.0 23,986.0 924.0 20.0 904.0 -105.0 27.0 -78.0 24,812.0 6,327.0 18,485.0 18,485.0 18,485.0 18,485.6 6.48 6.48 6.43 6.43 2.854.0 2,876.0 924.0 904.0 18,485.0 18,485.0 31-Dec-2018 12 Months Filed 30-Jan-2020 USD 1 Ernst & Young LLP Unqualified Net Income from Continuing and Discontinued Operations Dun & Bradstreet, Inc. 2020. All Rights Reserved. | Privacy Policy | Terms | Information Partners 55,013.0 55,838.0 9,355.0 46,483.0 3,451.0 34510 7,846.0 11,297.0 10,273.0 21,570.0 24,913.0 661.0 9.0 652.0 -2130 9.0 -204.0 25,361.0 3,249.0 22,112.0 22,112.0 22,112.0 -10 22,111.0 7.65 7.65 757 757 2,890.0 2,9210 10 661.0 9.0 652.0 22,112.0 22.112.0 USD 31-Dec-2017 12 Months Filed 30-Jan-2020 USD 1 Ernst & Young LLP Unqualified 39,942.0 40,453.0 5,454.0 35,199.0 25170 2.517.0 4,725.0 7,242.0 7,754.0 14,996.0 20,203.0 398.0 6.0 392.0 -6.0 5.0 -1.0 20,594.0 4,660.0 15,334.0 15,334.0 15,334.0 -14.0 15,320.0 5.49 5.49 5.39 5.39 2,901.0 2.956.0 140 398.0 6.0 392.0 15,934.0 15,334.0 Actions 31-Dec-2016 12 Months Filed 31-Jan-2019 USD 1 Ernst & Young LLP Unqualified with Explanation 26,885.0 27,638.0 3,789.0 23,849.0 1,731.0 1,731.0 3,772.0 5,503.0 5,919.0 11,422.0 12,427.0 176.0 30.0 166.0 -76.0 10 -75.0 12,518.0 2,301.0 10,217.0 10,217.0 10,217.0 10,188.0 3.56 3.56 3.49 2,863.0 2,925.0 176.0 31-Dec-2015 12 Months Filed 01-Feb-2018 USD 1 Ernst & Young LLP Unqualified 17,079.0 17,928.0 2.867.0 15,061.0 166.0 30,217.0 Generating your Report... 1,295.0 1,295.0 2,725.0 4,020.0 4,816.0 8,836.0 6,225.0 52.0 23.0 66.0 60 40.0 6,194.0 2.506.0 3,688.0 3,688.0 3,608.0 3,649.0 3 1.31 1.31 1.29 1.29 2,803.0 2.8530 19.0 52.0
Step by Step Solution
★★★★★
3.32 Rating (158 Votes )
There are 3 Steps involved in it
Step: 1
ANSWER There are two methods commonly used to read and analyze an organizations financial documents ...
Get Instant Access to Expert-Tailored Solutions
See step-by-step solutions with expert insights and AI powered tools for academic success
Step: 2

Step: 3

Ace Your Homework with AI
Get the answers you need in no time with our AI-driven, step-by-step assistance
Get Started


