Question
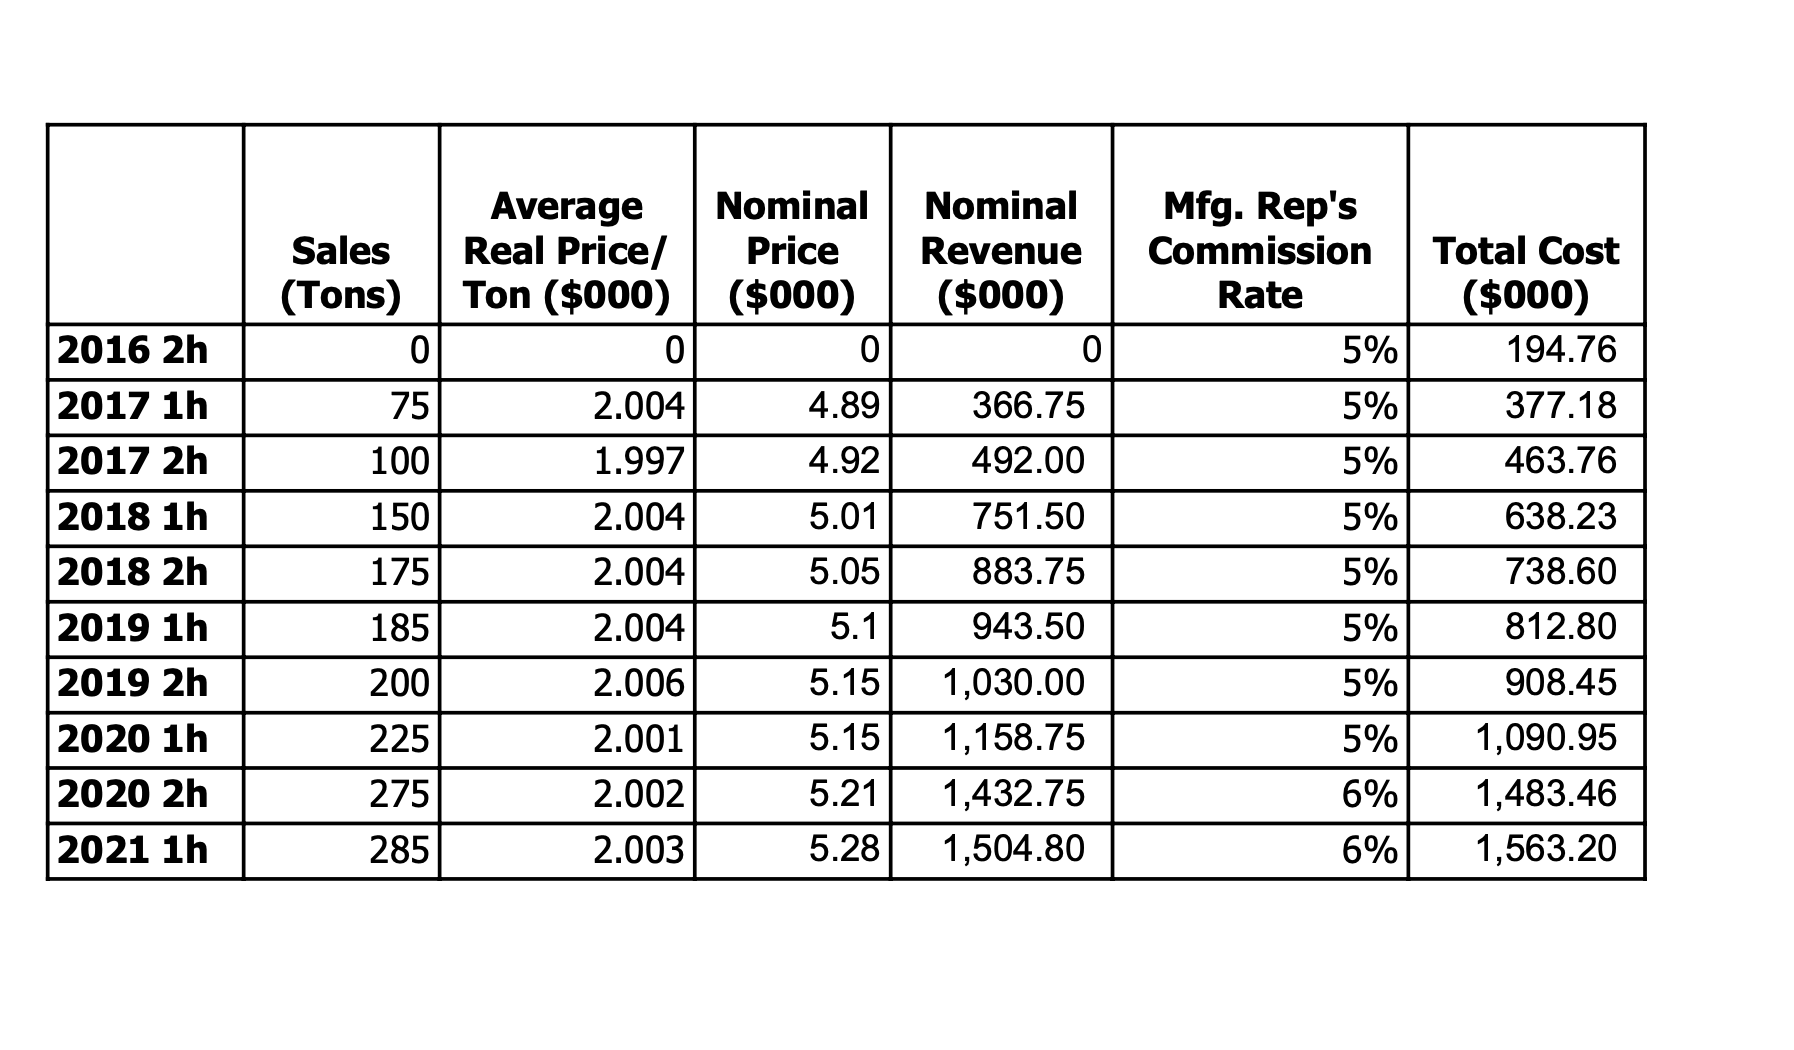
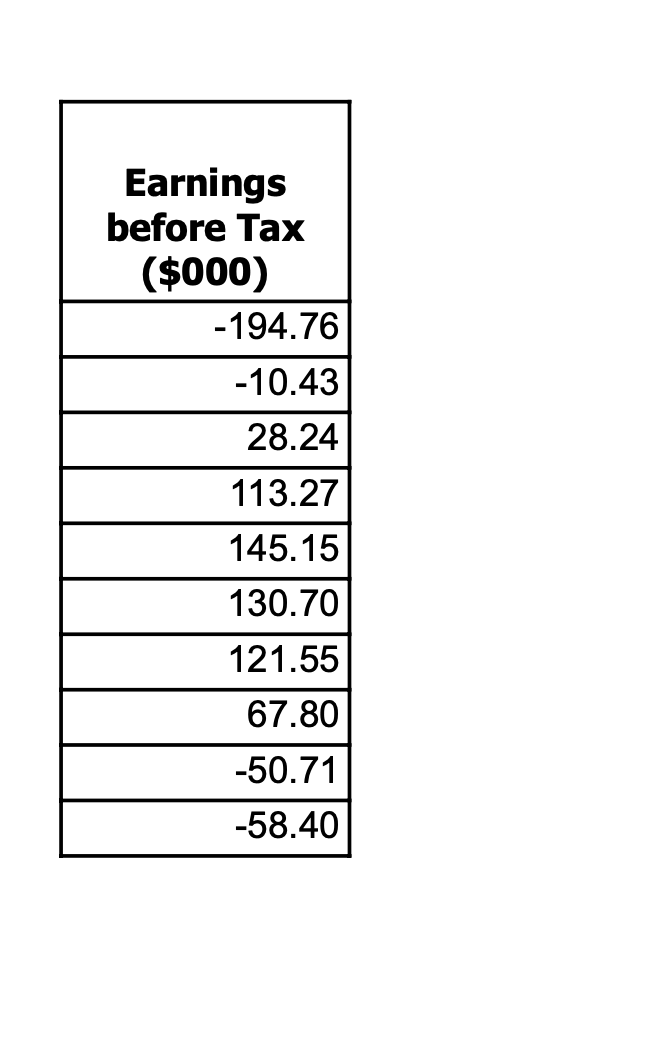
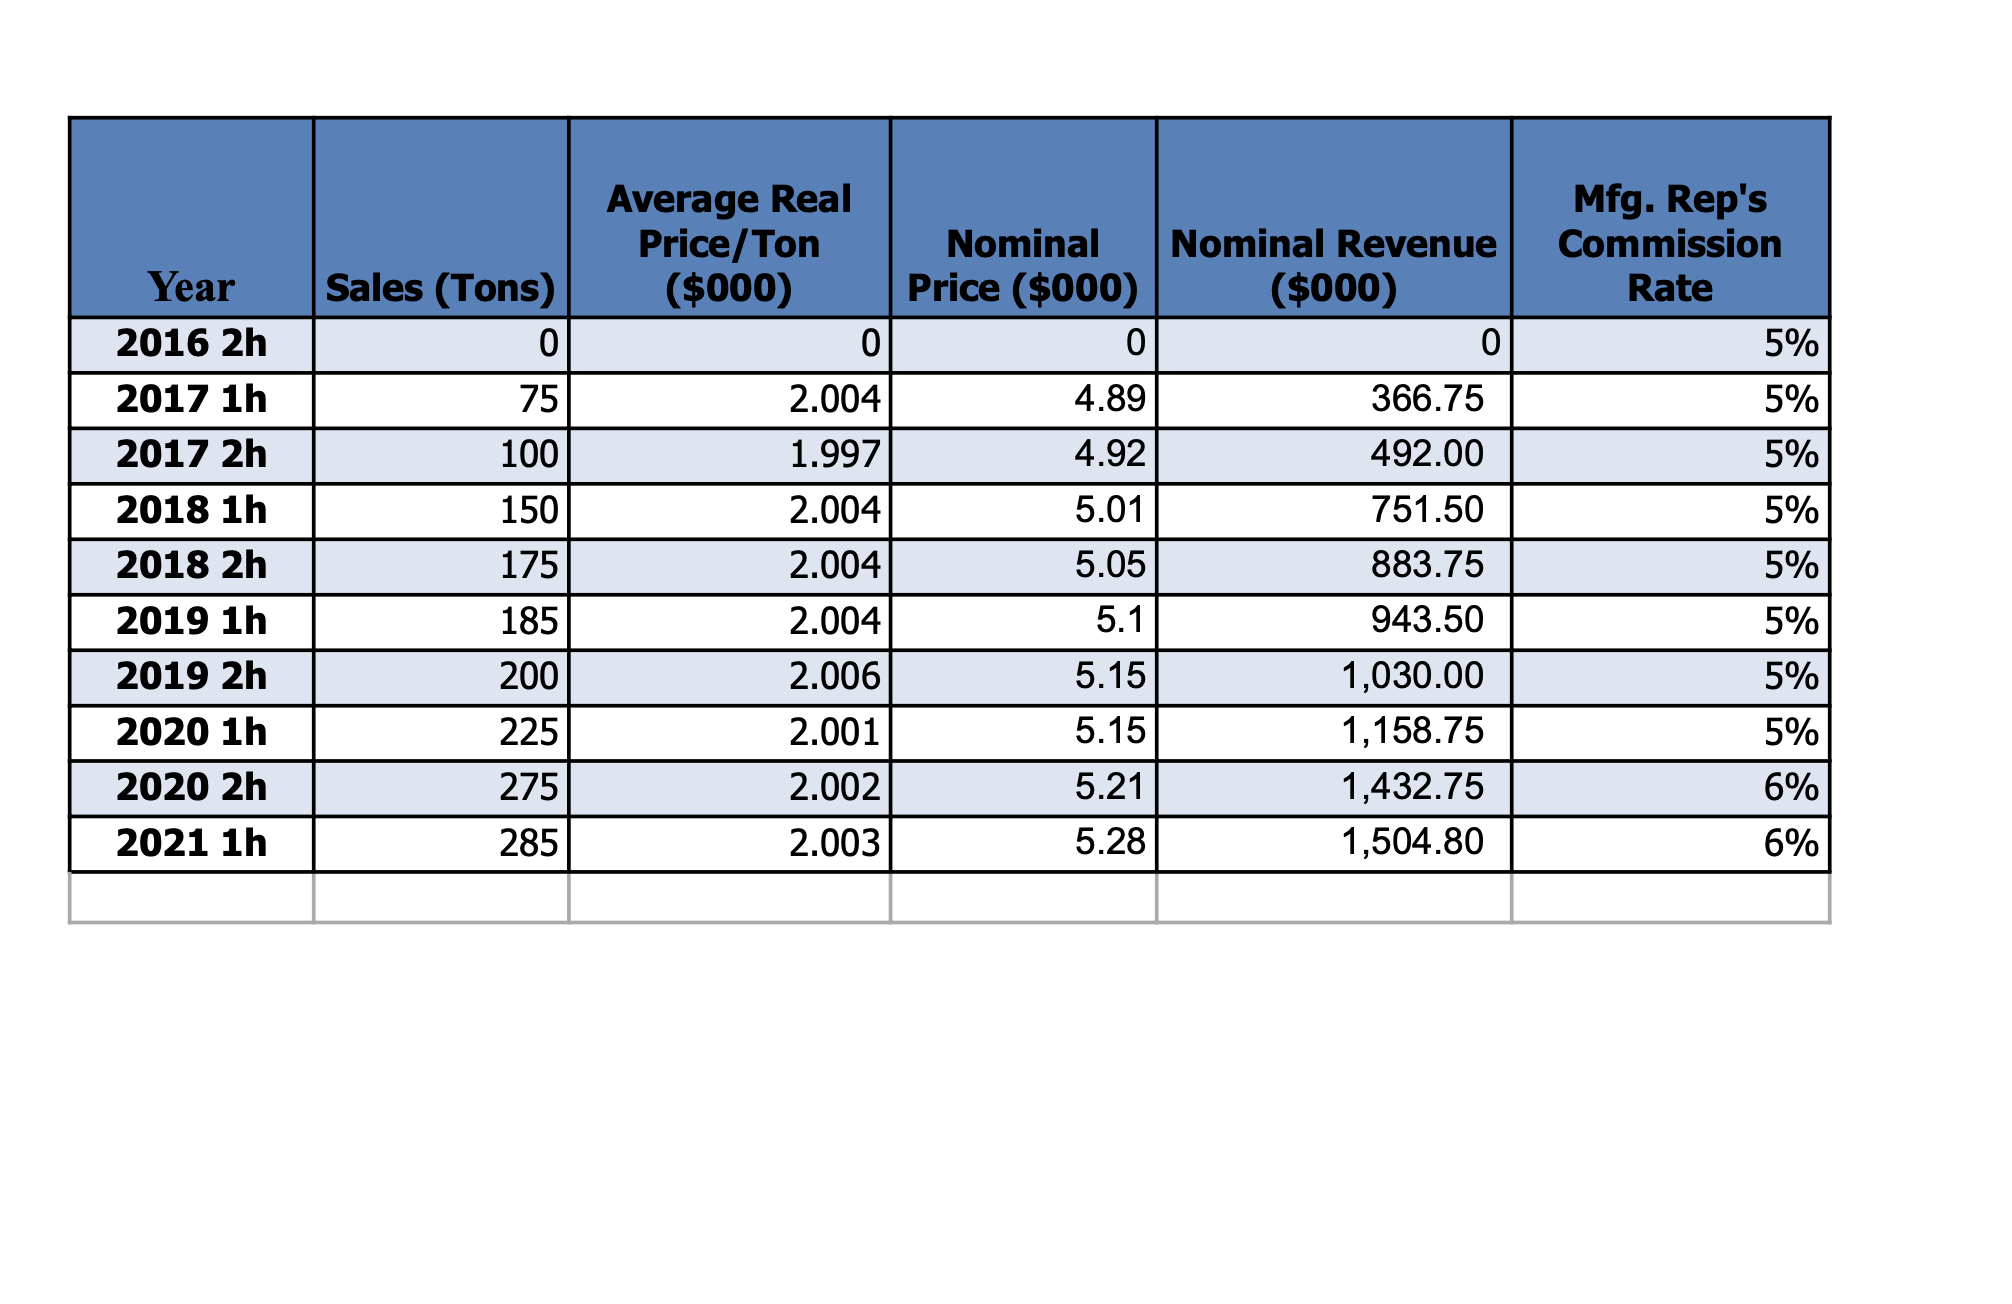
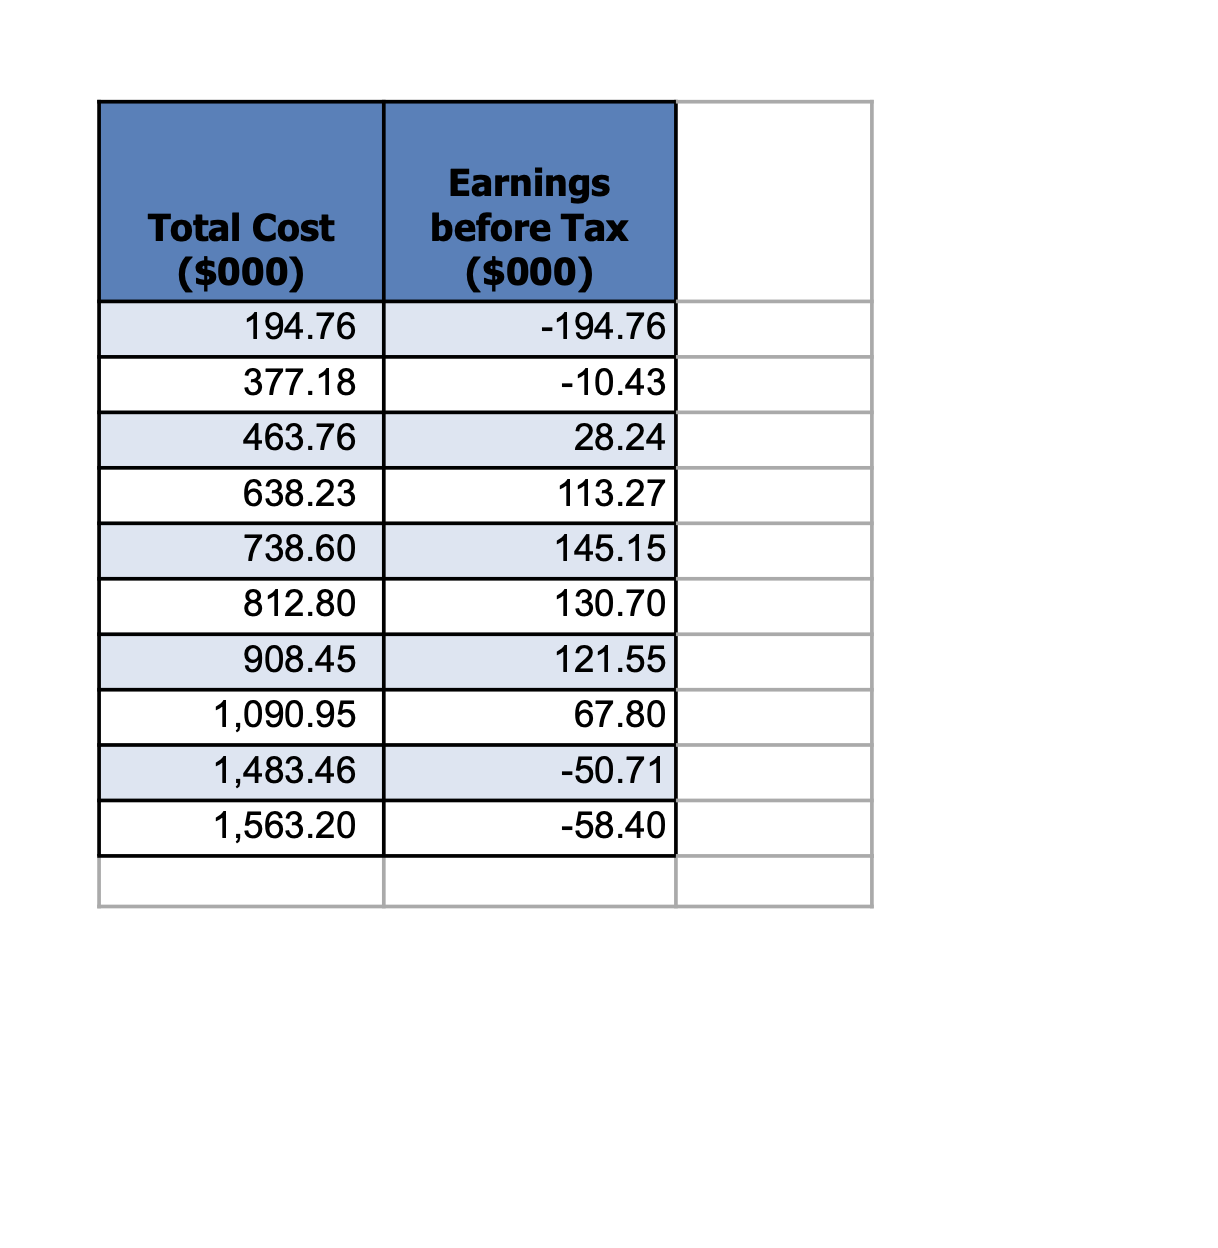
Create profit maximization graph using 3 tables number of employees, Inflations, and EBIT. Average Nominal Nominal Mfg. Rep's Sales (Tons) Real Price/ Price Revenue Commission
Create profit maximization graph using 3 tables number of employees, Inflations, and EBIT.


Average Nominal Nominal Mfg. Rep's Sales (Tons) Real Price/ Price Revenue Commission Total Cost Ton ($000) ($000) ($000) Rate ($000) 2016 2h 0 0 0 0 5% 194.76 2017 1h 75 2.004 4.89 366.75 5% 377.18 2017 2h 100 1.997 4.92 492.00 5% 463.76 2018 1h 150 2.004 5.01 751.50 5% 638.23 2018 2h 175 2.004 5.05 883.75 5% 738.60 2019 1h 185 2.004 5.1 943.50 5% 812.80 2019 2h 200 2.006 5.15 1,030.00 5% 908.45 2020 1h 225 2.001 5.15 1,158.75 5% 1,090.95 2020 2h 275 2.002 5.21 1,432.75 6% 1,483.46 2021 1h 285 2.003 5.28 1,504.80 6% 1,563.20
Step by Step Solution
There are 3 Steps involved in it
Step: 1

Get Instant Access to Expert-Tailored Solutions
See step-by-step solutions with expert insights and AI powered tools for academic success
Step: 2

Step: 3

Ace Your Homework with AI
Get the answers you need in no time with our AI-driven, step-by-step assistance
Get StartedRecommended Textbook for
Income Tax Fundamentals 2013
Authors: Gerald E. Whittenburg, Martha Altus Buller, Steven L Gill
31st Edition
1111972516, 978-1285586618, 1285586611, 978-1285613109, 978-1111972516
Students also viewed these Economics questions
Question
Answered: 1 week ago
Question
Answered: 1 week ago
Question
Answered: 1 week ago
Question
Answered: 1 week ago
Question
Answered: 1 week ago
Question
Answered: 1 week ago
Question
Answered: 1 week ago
Question
Answered: 1 week ago
Question
Answered: 1 week ago
Question
Answered: 1 week ago
Question
Answered: 1 week ago
Question
Answered: 1 week ago
Question
Answered: 1 week ago
Question
Answered: 1 week ago
Question
Answered: 1 week ago
Question
Answered: 1 week ago
Question
Answered: 1 week ago
Question
Answered: 1 week ago
Question
Answered: 1 week ago
Question
Answered: 1 week ago
Question
Answered: 1 week ago
Question
Answered: 1 week ago
View Answer in SolutionInn App


