Create program, first, prompt the user for a # of years to enter for a player. Then, prompt the user for the player's starting year and then read in the statistics of the player for each of those years. The program should finish by printing out the highest year and lowest year for the player. It should behave like the sample below:
Sample 1
# of years: 5
Starting year: 1999
Stat for year 1999: 4
Stat for year 2000: 3
Stat for year 2001: 8
Stat for year 2002: 10
Stat for year 2003: 12
Best stat was 12 in year 2003
Worst stat was 3 in year 2000
Sample 2
# of years: 6
Starting year: 2012
Stat for year 2012: 85
Stat for year 2013: 36
Stat for year 2014: 77
Stat for year 2015: 32
Stat for year 2016: 10
Stat for year 2017: 48
Best stat was 85 in year 2012
Worst stat was 10 in year 201
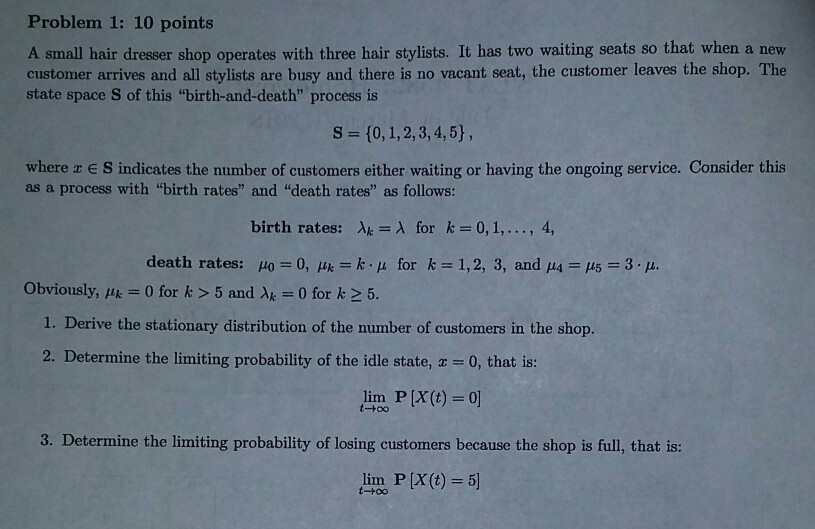
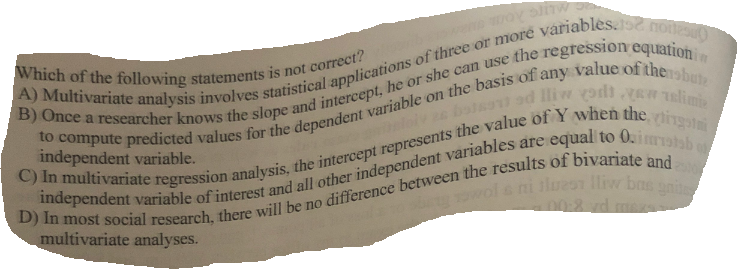
Question 25 Simple Regression analysis and Mumvariate Regression Analysis me raised to each other in ihn following way; @) Both techniques use a goodness of fit musmire, but the goodness of fit meamie in Muhivanale Regression adjusts Nu the fact that an coun miinhis aduspammin Ingphompants Simple Regression is simpler than Multivariate Regression because the dependent variable is aways a straight line function of the independent sunable un a graph Multivariate regression always proves causation, but simple regression can never prove causation Both simple and multiple regression face the problem of multicollinearity11. Give an example of each or prove that it is impossible. (1) A sequence with an infinite number of ones that does not converge to one. (2) A sequence with an infinite number of ones that converges to a limit not equal to one. (3) A sequence that does not converge such that for every n E N it is possible to find n consecutive ones somewhere in the sequence.Problem 1: 10 points A small hair dresser shop operates with three hair stylists. It has two waiting seats so that when a new customer arrives and all stylists are busy and there is no vacant seat, the customer leaves the shop. The state space S of this "birth-and-death" process is S = {0, 1, 2, 3, 4, 5} , where a E S indicates the number of customers either waiting or having the ongoing service. Consider this as a process with "birth rates" and "death rates" as follows: birth rates: Ak = A for k = 0, 1, ..., 4, death rates: /0 = 0, #x = k . u for k = 1, 2, 3, and #4 = 45 = 3 . H. Obviously, /k = 0 for k > 5 and Ak = 0 for k 2 5. 1. Derive the stationary distribution of the number of customers in the shop. 2. Determine the limiting probability of the idle state, x = 0, that is: lim P [X(t) = 0] 1 -+ 0o 3. Determine the limiting probability of losing customers because the shop is full, that is: lim P [X(t) = 5] 1-tooWhich of the following statements is not correct? Multivariate analysis in critical applications of three comesfromroles. log in Once a researcher known the land intercept, he or she can the onelesson equal wellpute predicted value for the dependent variable on the basis in my value of the independent variable. botsour ed Hiw world , yaw islime a multivariate regression analysis the intercept represents the white off when the rule dependent variable of interest and all other independent variables are equal to 0. ) In most social research there will be no difference between the festints of bivariate but multivariate analyses. wol s ni blueon Hiw bus gnits


