Answered step by step
Verified Expert Solution
Question
1 Approved Answer
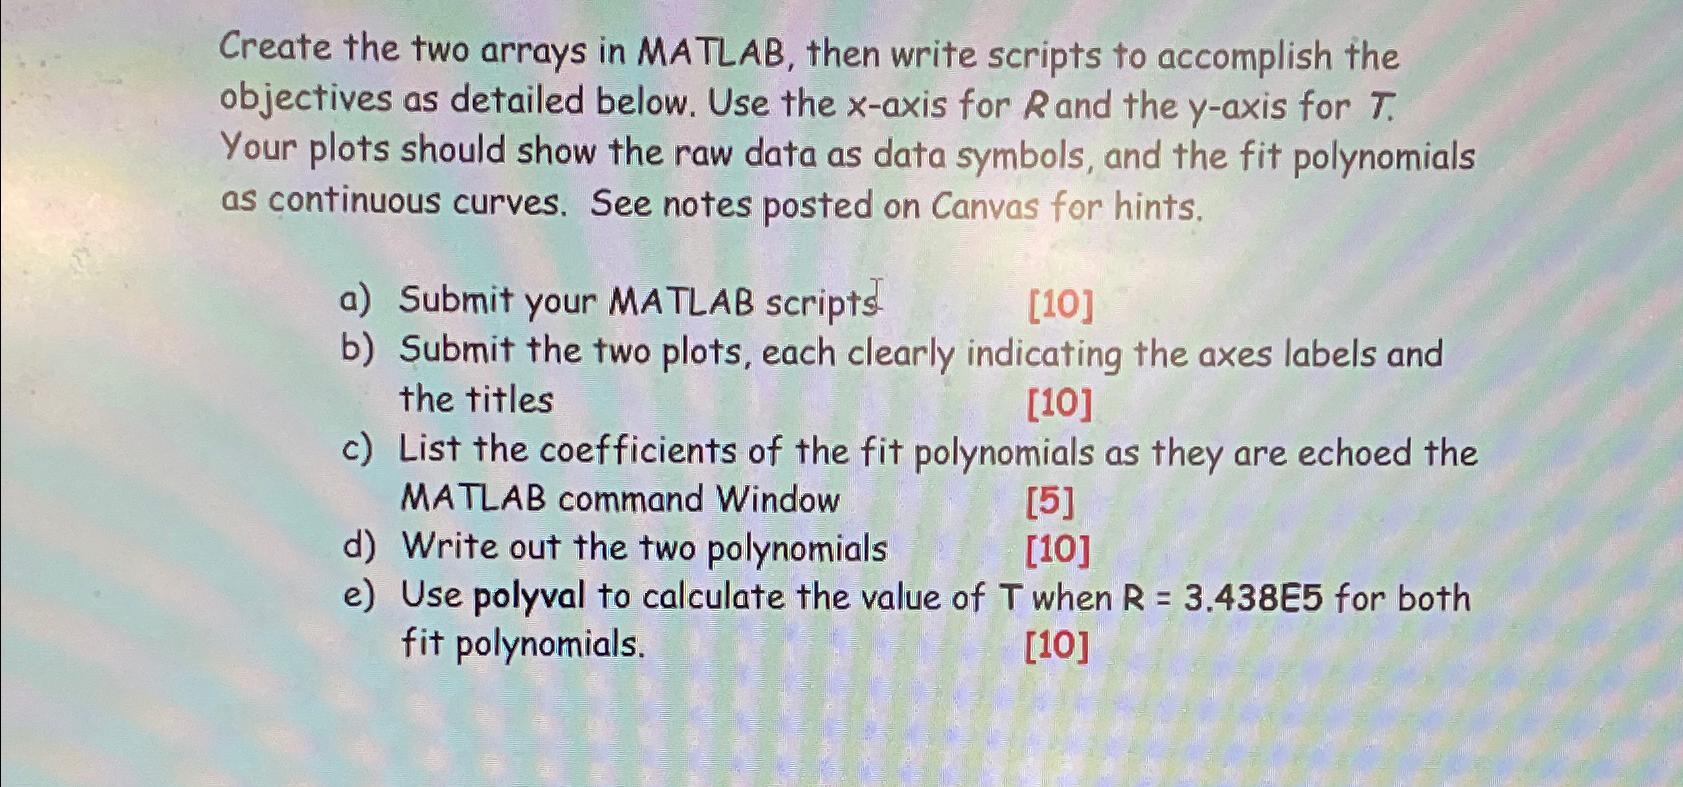
Create the two arrays in MATLAB, then write scripts to accomplish the objectives as detailed below. Use the x - axis for R and the
Create the two arrays in MATLAB, then write scripts to accomplish the objectives as detailed below. Use the axis for and the axis for Your plots should show the raw data as data symbols, and the fit polynomials as continuous curves. See notes posted on Canvas for hints.
a Submit your MATLAB scripts
b Submit the two plots, each clearly indicating the axes labels and the titles
c List the coefficients of the fit polynomials as they are echoed the MATLAB command Window
d Write out the two polynomials
e Use polyval to calculate the value of when for both fit polynomials.

Step by Step Solution
There are 3 Steps involved in it
Step: 1

Get Instant Access to Expert-Tailored Solutions
See step-by-step solutions with expert insights and AI powered tools for academic success
Step: 2

Step: 3

Ace Your Homework with AI
Get the answers you need in no time with our AI-driven, step-by-step assistance
Get Started


