

Answered step by step
Verified Expert Solution
Question
1 Approved Answer
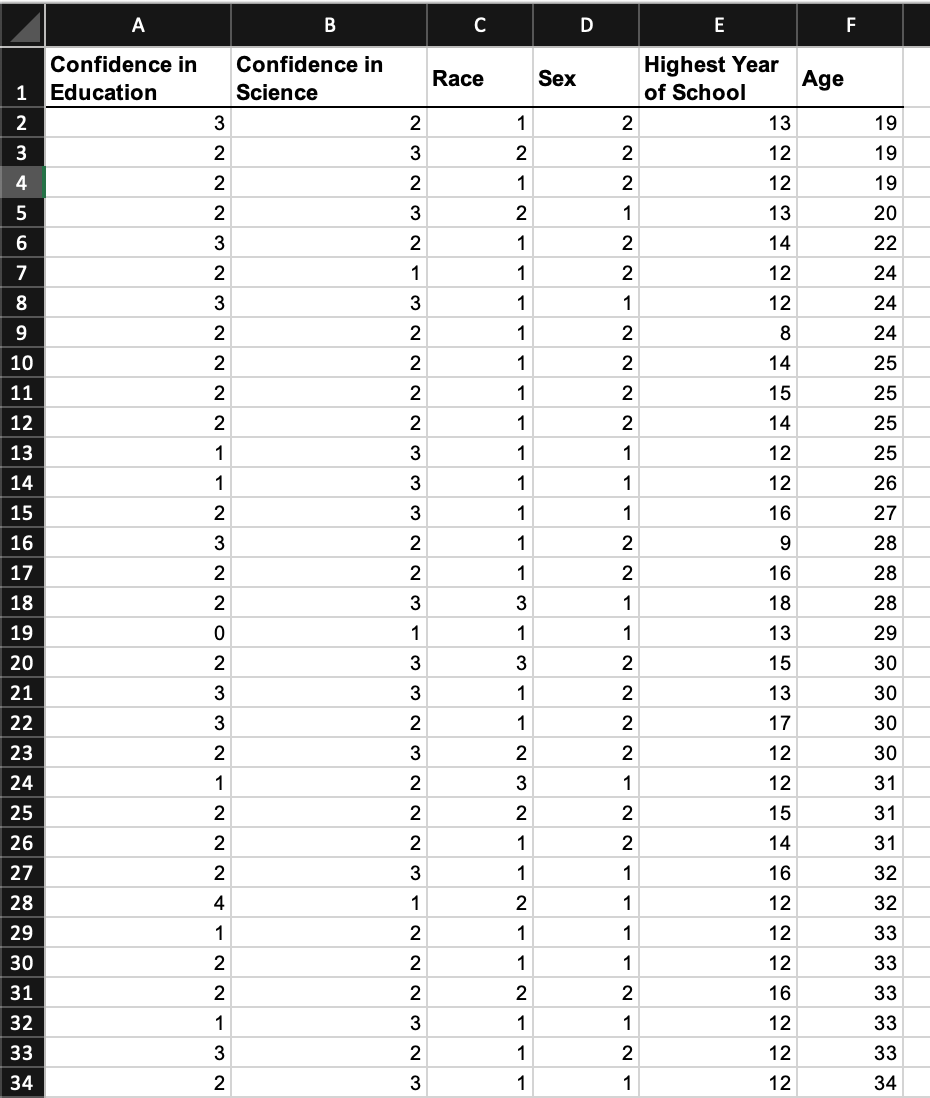
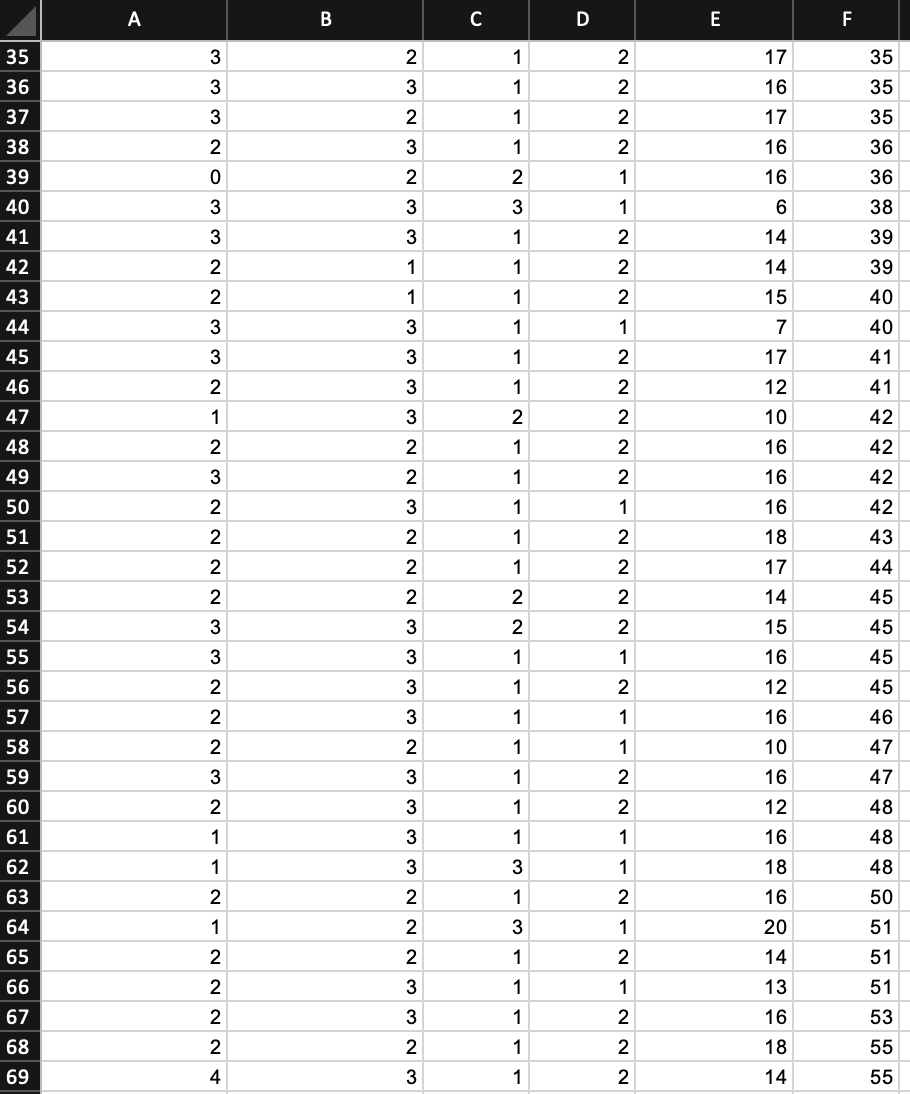
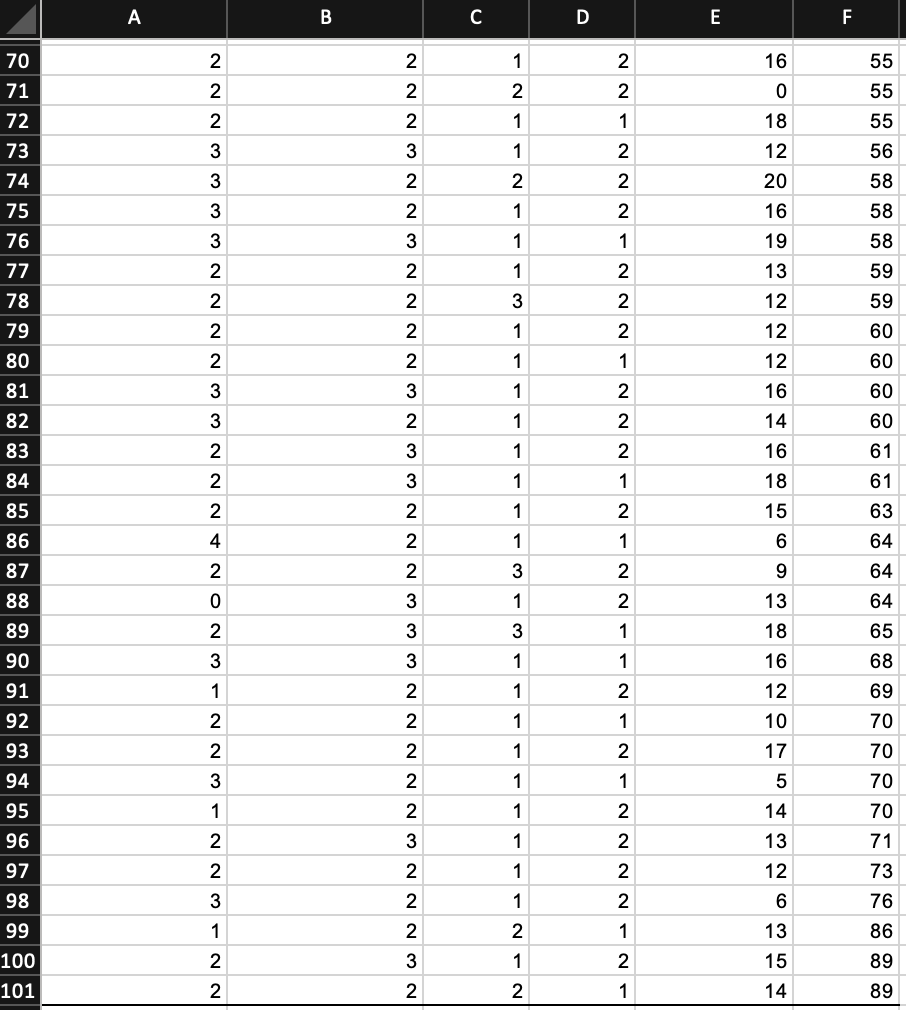
Create Your Graphs First, use the data set below to create two graphs: El 1. A pie chart for Race 2. A histogram for Age,
Step by Step Solution
There are 3 Steps involved in it
Step: 1

Get Instant Access to Expert-Tailored Solutions
See step-by-step solutions with expert insights and AI powered tools for academic success
Step: 2

Step: 3
Ace Your Homework with AI
Get the answers you need in no time with our AI-driven, step-by-step assistance
Get Started
Calculus With Applications, Version
Authors: Margaret L Lial, Raymond N Greenwell, Nathan P Ritchey
10th Edition
032183111X, 9780321831118