Answered step by step
Verified Expert Solution
Question
1 Approved Answer
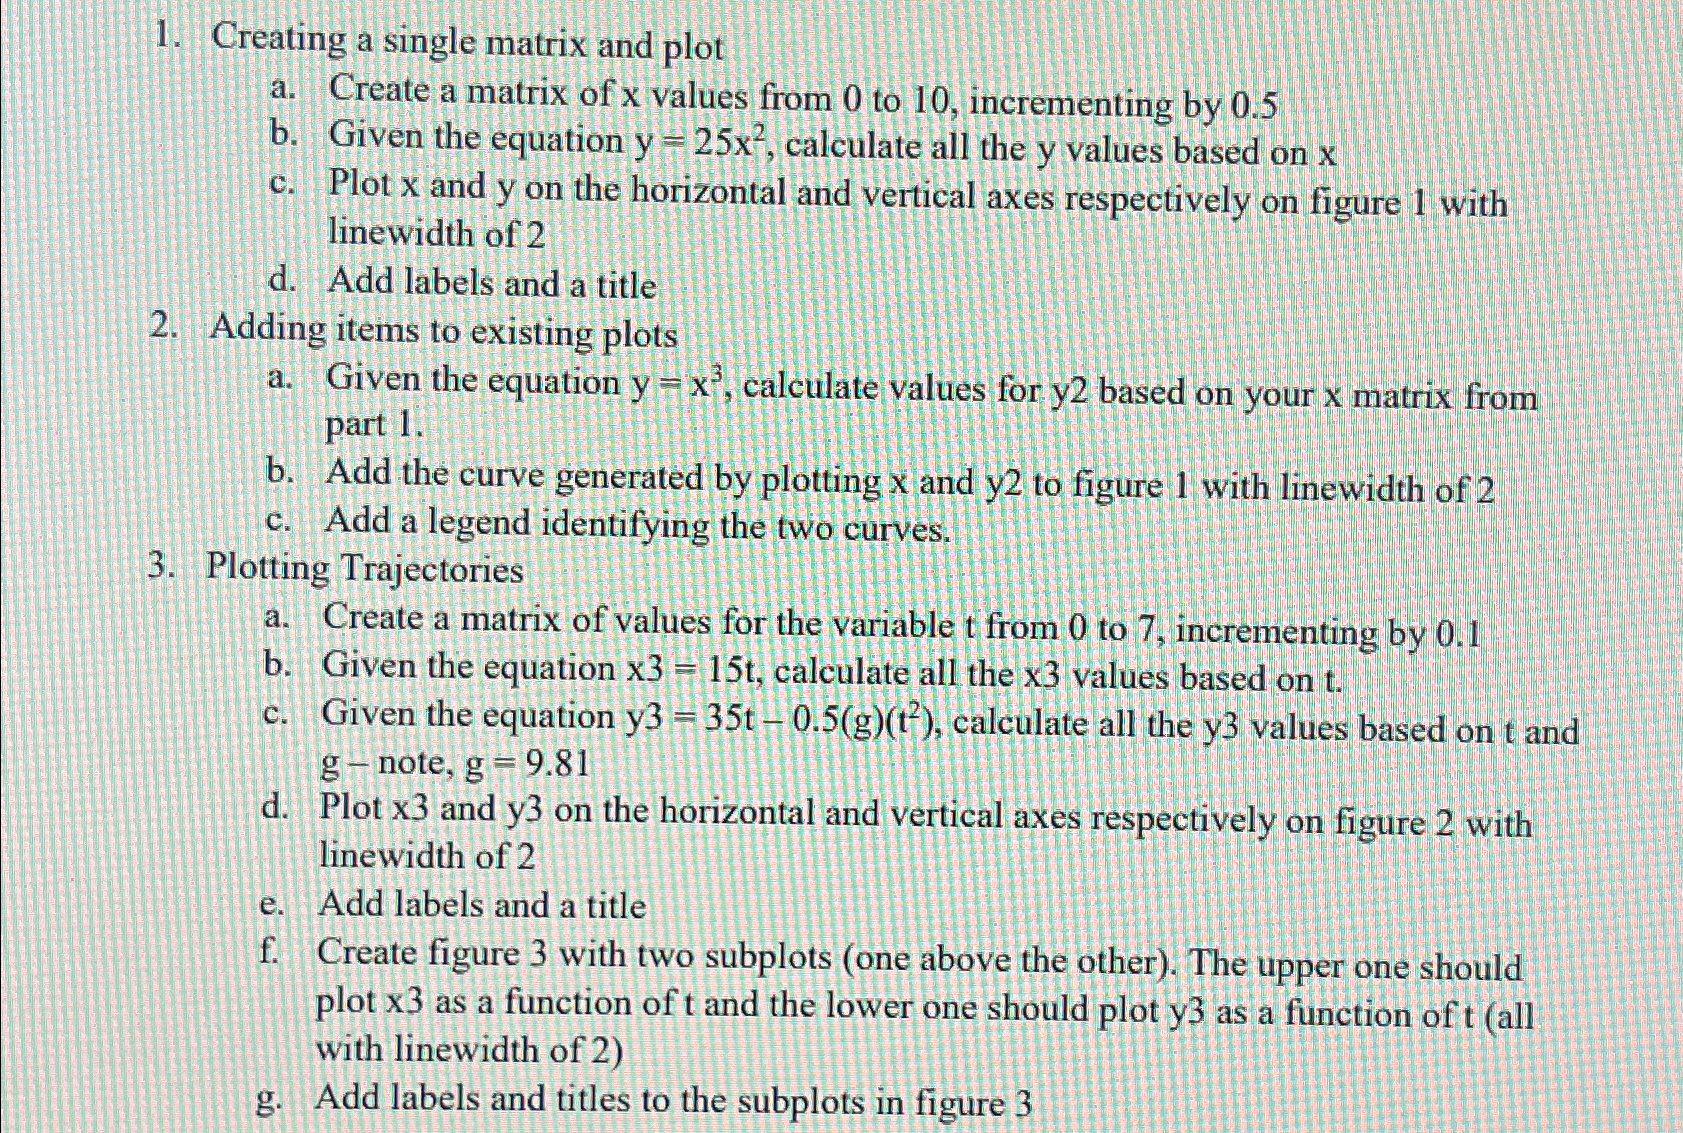
Creating a single matrix and plot a . Create a matrix of x values from 0 to 1 0 , incrementing by 0 . 5
Creating a single matrix and plot
a Create a matrix of values from to incrementing by
b Given the equation calculate all the values based on
c Plot and on the horizontal and vertical axes respectively on figure with linewidth of
d Add labels and a title
Adding items to existing plots
a Given the equation calculate values for based on your matrix from part
b Add the curve generated by plotting and to figure with linewidth of
c Add a legend identifying the two curves.
Plotting Trajectories
a Create a matrix of values for the variable from to incrementing by
b Given the equation calculate all the values based on
c Given the equation calculate all the values based on and note,
d Plot and on the horizontal and vertical axes respectively on figure with linewidth of
e Add labels and a title
f Create figure with two subplots one above the other The upper one should plot as a function of and the lower one should plot as a function of all with linewidth of
g Add labels and titles to the subplots in figure

Step by Step Solution
There are 3 Steps involved in it
Step: 1

Get Instant Access to Expert-Tailored Solutions
See step-by-step solutions with expert insights and AI powered tools for academic success
Step: 2

Step: 3

Ace Your Homework with AI
Get the answers you need in no time with our AI-driven, step-by-step assistance
Get Started


