Question
Creating Standardized values (z scores) for some variables (satisfaction, price sensitivity, and age). The DESCRIPTIVES command with the SAVE subcommand was used to make standardized
Creating Standardized values (z scores) for some variables (satisfaction, price sensitivity, and age).
The DESCRIPTIVES command with the SAVE subcommand was used to make standardized variables. It will only save standardized z scores to all the listed variables in the file. Consider the following command syntax:
DESCRIPTIVES VARIABLES= satisfaction price sensitivity age
/SAVE
The command makes standardized values for satisfaction, price sensitivity, and age. New variables zsatisfaction, zpriceSensitivity zage are saved to the occupied file, comprising the chosen standardized variables. During the analysis, SPSS saved the identified variables by placing "z" in front of every variable name.
Also, to handle the descriptive analysis of the standardized variables, open the SPSS menu>choose to analyze> Descriptive statistics> Descriptive. Specify satisfaction, price, and sensitivity age as the variables of interest. Then, it followed by checking the box to save the standardized variables.
After running the command and even utilizing the SPSS analyze menu, the following outcome was obtained.

Further, a descriptive command was executed to confirm the variables were correctly standardized.
DESCRIPTIVES VARIABLES=Satisfaction Age PriceSensitivity ZSatisfaction ZAge ZPriceSensitivity
/SAVE
The outcome was as follows.
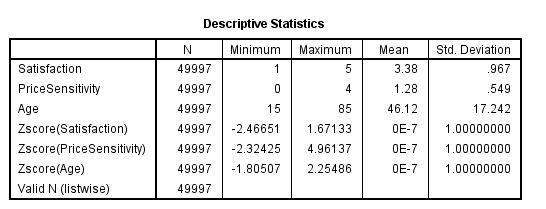
The results above show that indeed ZSatisfaction ZAge and ZPriceSensitivity are standardized. Z-sores or standardized scores have 0 as the mean score and 1 as the standard deviation.
Marketing managers use K-means to conduct a survey conveying needs, attitudes, and the behavior of customers. The cluster analysis conducted identifies what homologous groups exist among customers in airline solutions. The number of clusters was defined in advance as three. This was useful to help in testing different models with a different assumed number of clusters.
The process used in the SPSS menu for the analysis is as follows. Analyze>select classify> K-means. A new tab, k-mean clustering, is opened, whereby the interest variables are selected. Several clusters are customized as three, and the cluster membership is selected in the save option. Some common features had to remain by default as they were not identified in the problem. Iterations are chosen as 10 and convergence as 0. After running the k-means cluster analysis using SPSS statistics, the following results were displayed as the output.
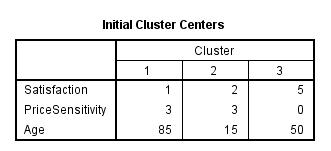
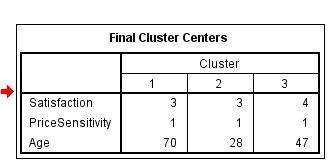
The Convergence of the dataset is attained due to small variation in cluster centers. See the iteration table below.
|
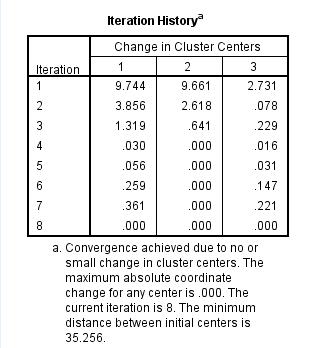
The number of cases for all cluster table is as follows:
Cluster1: 12292.000
Cluster2: 17073.000
Cluster3: 20632.000
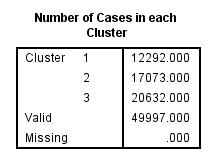
Each of the selected three variables is used to compare the cluster configurations based on the cluster sums, means, and variations. The report shows how the variables are used to examine the optimum number of clusters. The result indicates the number of cases of variables across each of the clusters. Thus variables contribute to an effective solution.
ANOVA
The results are summarized by performing a one-way ANOVA test on each variable, using the currently defined clusters as the factors. This process helps to investigate how each variable is useful in the clustering process. The ANOVA test results are displayed below. 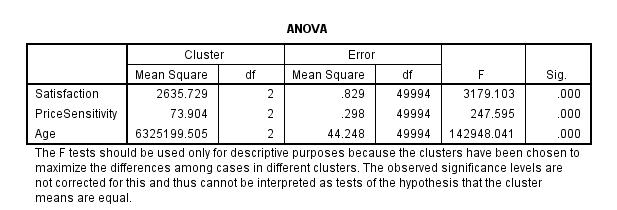 |
The average satisfaction is slightly higher in cluster 3 followed closely by cluster 2 and then in cluster 1. The difference is negligible, implying that all the clusters have almost the same satisfactory levels. There is equal distribution in price distribution across all the clusters. The mean average of age is higher in cluster 1, cluster 3 follows in the lead, and cluster 1 has the lowest mean of the variable age. 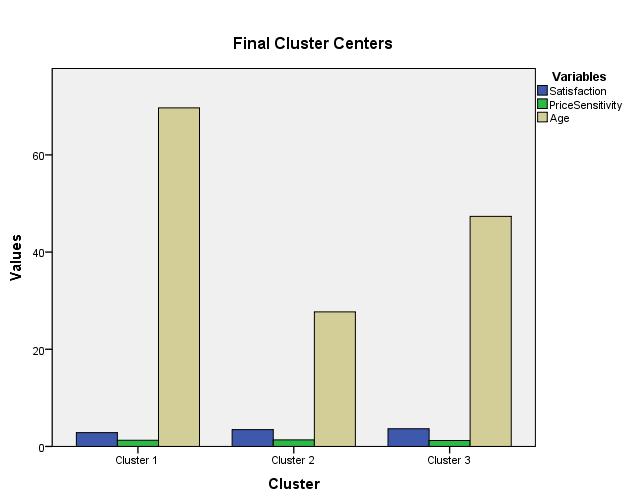 |
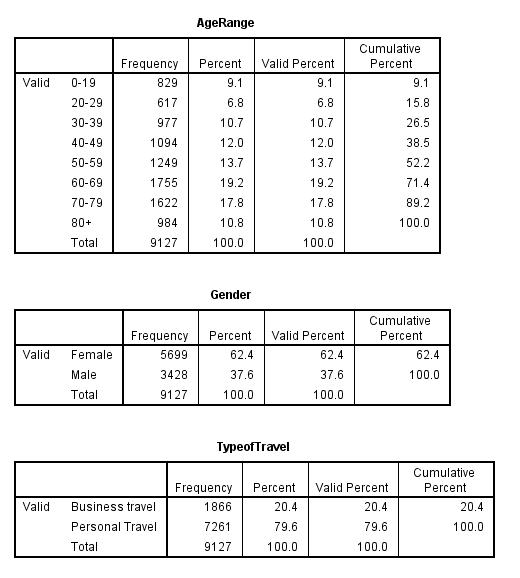
In this part, we select cases in SPSS using the 'Satisfaction' as the interest variable and show how it works as a resultant filtered data. The desired cluster satisfaction 2,3 4 are used to perform a hypothetical study which examines its relationship with Age Range, Gender, and Type of the airline Travel. The idea is to n expression in the text box to function in selecting cases. On running the selected clusters, we start with the first select case of 'satisfaction as 2'.
The frequency of the first cluster of those with satisfaction rate of 2 is 9127. The mean value of the female who responded with a satisfaction rate of 2 is 5699 and that of males is 3428.

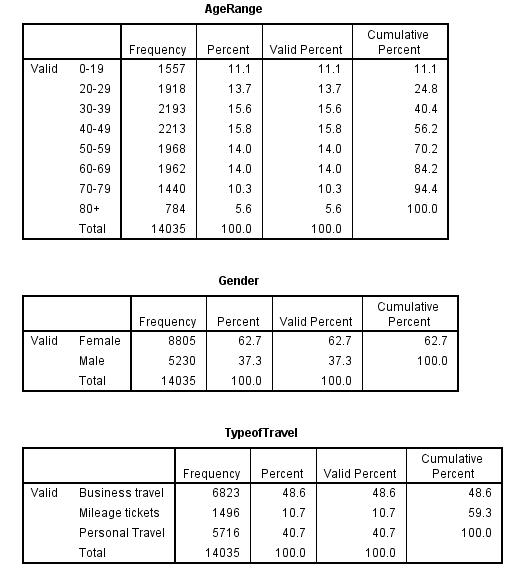
Cluster 2 is where the satisfaction rate is taken to be 3. The frequency of the first cluster of those with satisfaction rate of 3 is 14035. The females who responded with a satisfaction rate of 3 were 8805 and males were 5230. Also, there were 6823 business travel individuals, 1496 who had mileage tickets, and personal travel individuals were 5716.

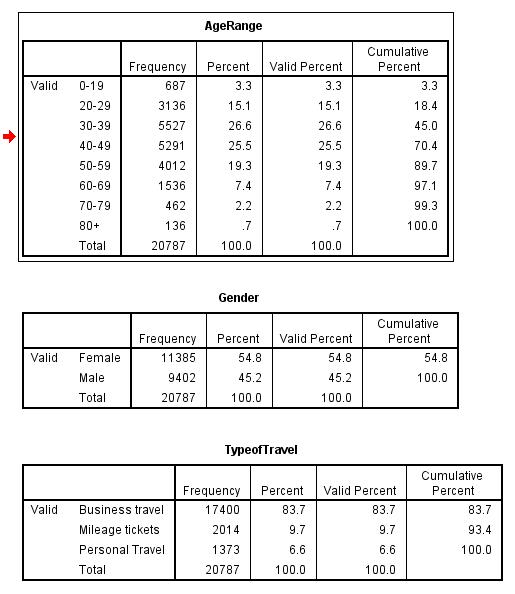
In cluster 3, we take satisfaction rate as 4. The frequency of the first cluster of those with satisfaction rate of 4 is 20787. The females who responded with a satisfaction rate of 3 were 11385 and males were 9402. Also, there were 17400 business travel individuals, 2014 who had mileage tickets, and personal travel individuals were 1373.

- Marketing actions for cluster 1
Females are more attracted in the airline than males. More offers and marketing strategies to be deployed especially in males. Also, business awareness should be created to increase more persons travel for business related activities.
- Marketing action for Cluster2.
Advertisements for mileage tickets and promotions to be done locally through social media and newspapers.
- Marketing action for Cluster 3
A special flight free-offer to be introduce for males only. It will help them realize the need of travelling via the airline.
Part 11
The SPSS TwoStep clustering is scalable to handle the cluster analysis algorithms of the given datasets. All the interest variable is continuous, and the data is passed through the procedure. The log-likelihood is selected automatically in the distance measure, while the Akaikes' information Criterion (AIC) is not selected automatically in the clustering criterion.
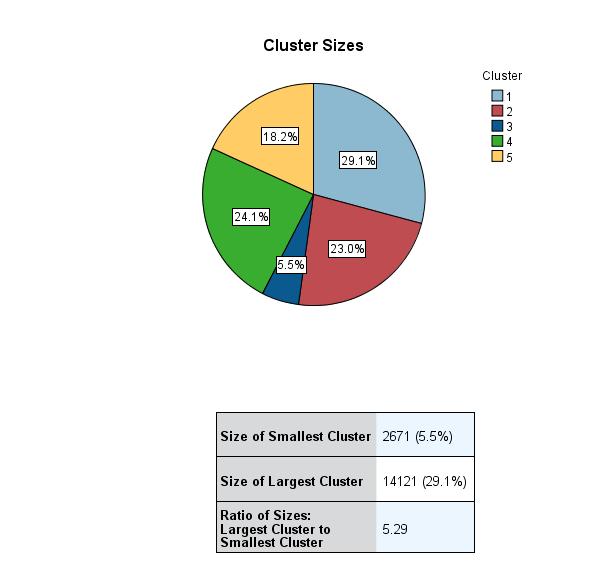
Accurate and scalable results are gathered in the simulation. The execution shows an automatic procedure of finding the number of clusters. The generated cluster number is 5.
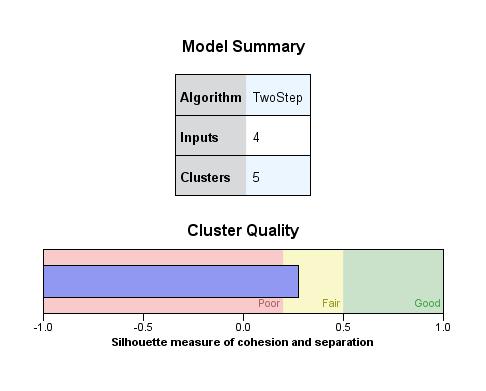
The ratio of sizes of the largest and smallest clusters is 5.29. The figure below illustrates this.
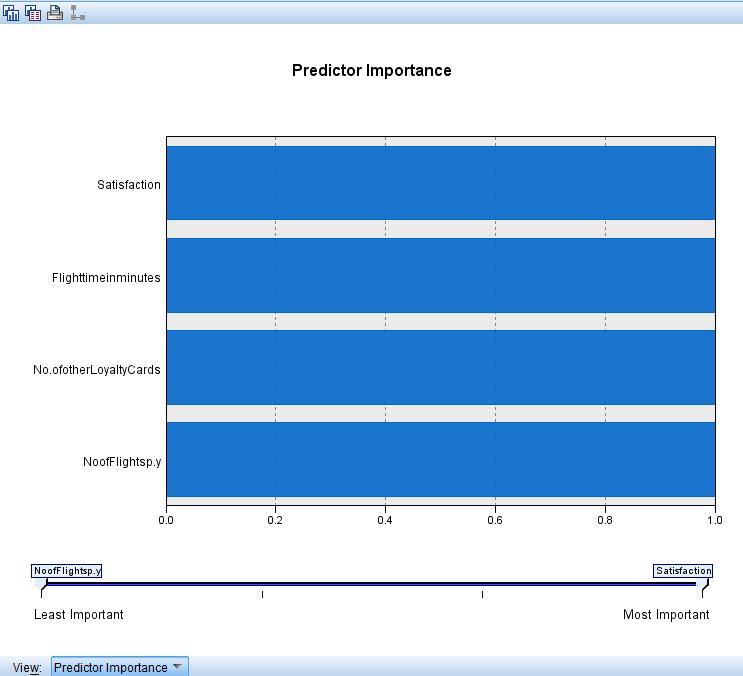
All the measures are standardized in a range of 0 to 1. The maximum value of the predictor Is set to be 1. All four variables take the largest value of transformation. Thus they are essential in predicting the clusters. The predictor importance model is shown below.
Cluster 2 has the top satisfaction with a mean rate of 4.23.
Cluster 4 has the lowermost satisfaction with a mean rate of 2.39.
Flight time in Minutes has the most significant impact on satisfaction. Its mean and median value is hugely higher compared to other inputs.
The data available in the model viewer for the cluster comparison is shown below.
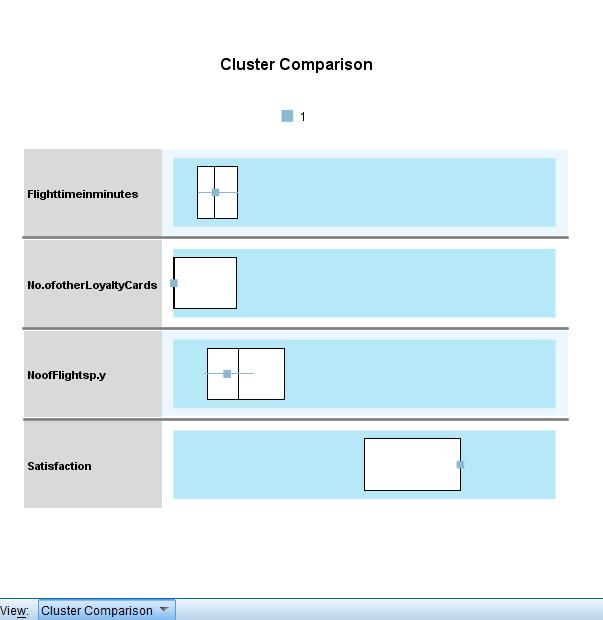
From the Analysis, on average, people who have a low number of other loyalty cards and take the most flights per year are the least satisfied. The airline should either focus more on increasing the flight time in minutes or develop a better plan to secure more loyalty cards for people who most take the flight annually.

Satisfaction PriceSensitivity Age Valid N (listwise) N 49997 49997 49997 49997 Descriptive Statistics Minimum Maximum 1 0 15 5 4 85 Mean 3.38 1.28 46.12 Std. Deviation .967 549 17.242
Step by Step Solution
There are 3 Steps involved in it
Step: 1

Get Instant Access to Expert-Tailored Solutions
See step-by-step solutions with expert insights and AI powered tools for academic success
Step: 2

Step: 3

Ace Your Homework with AI
Get the answers you need in no time with our AI-driven, step-by-step assistance
Get Started


