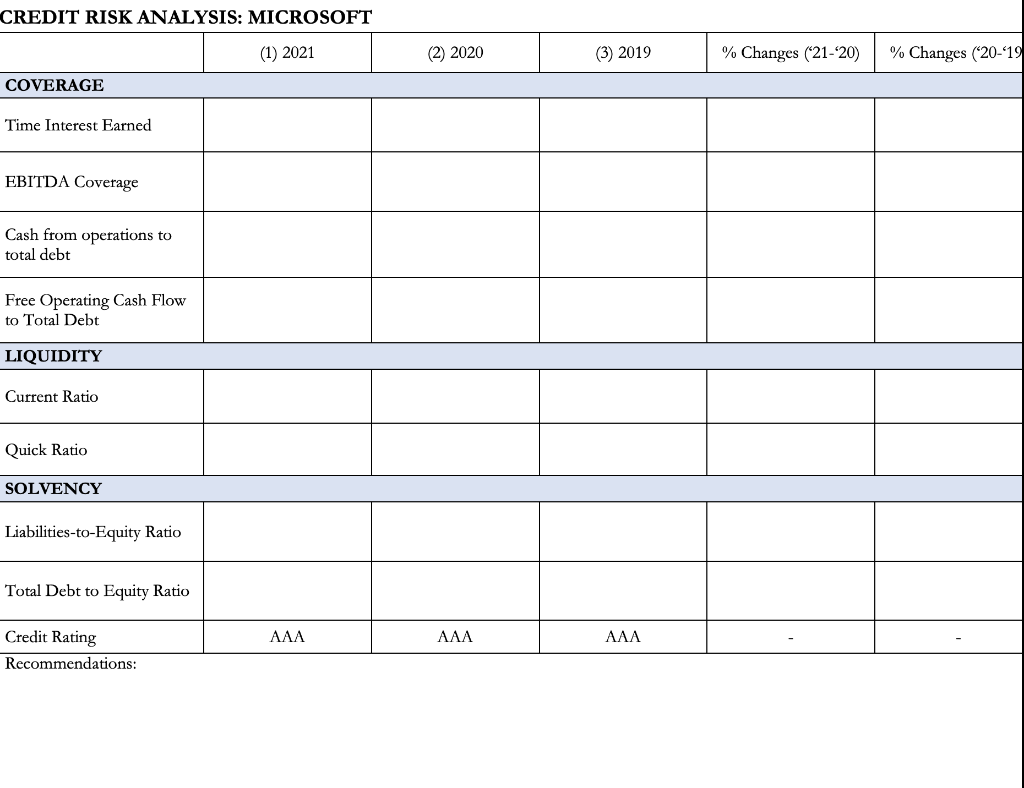
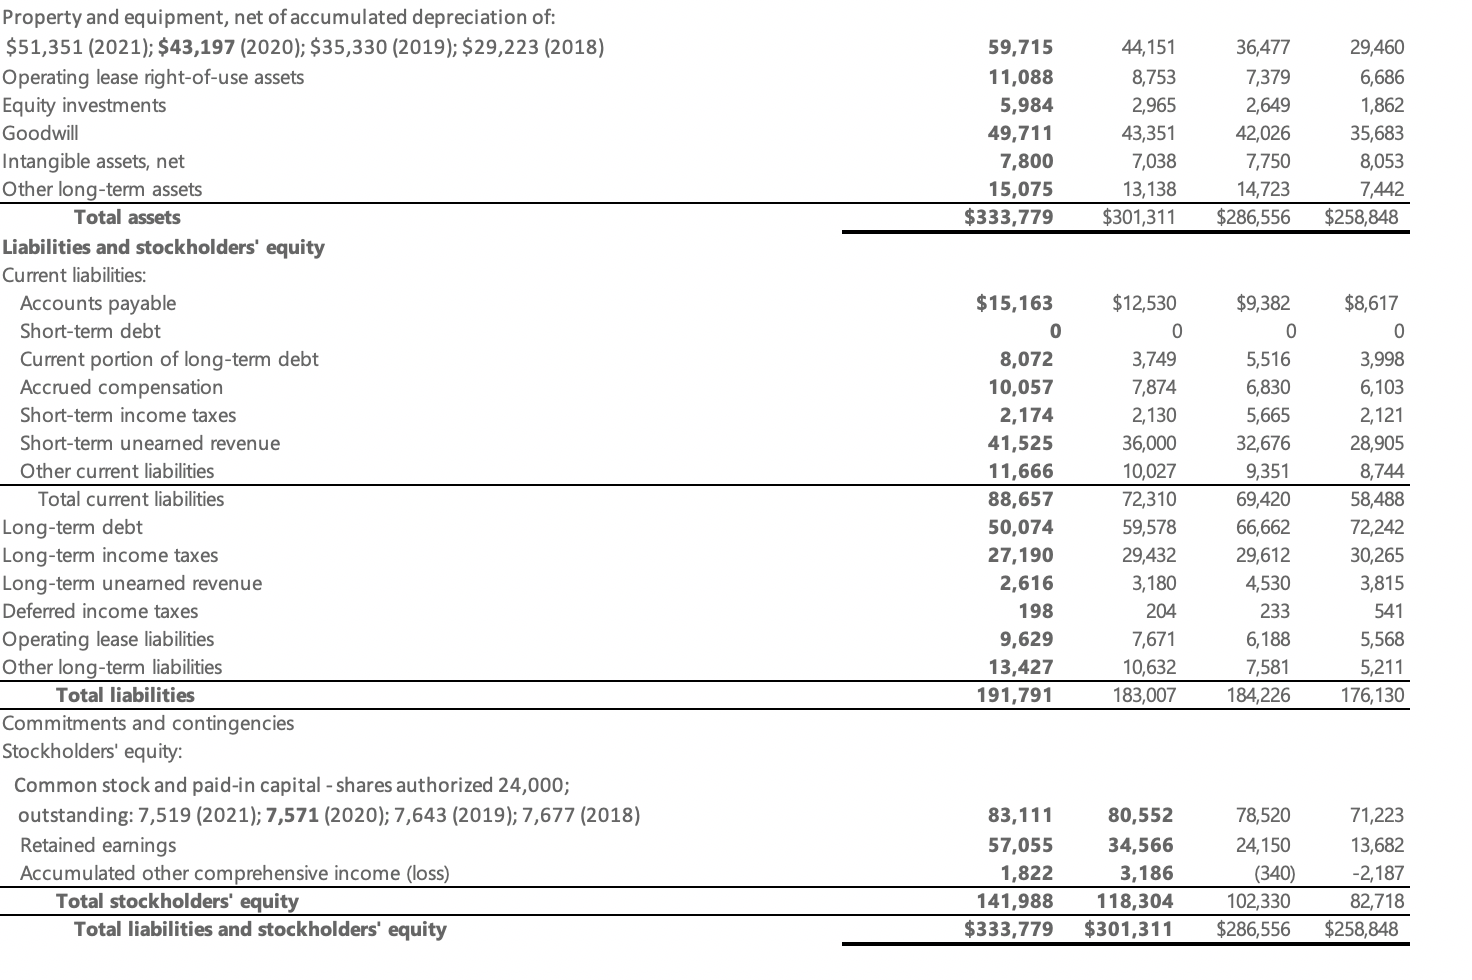
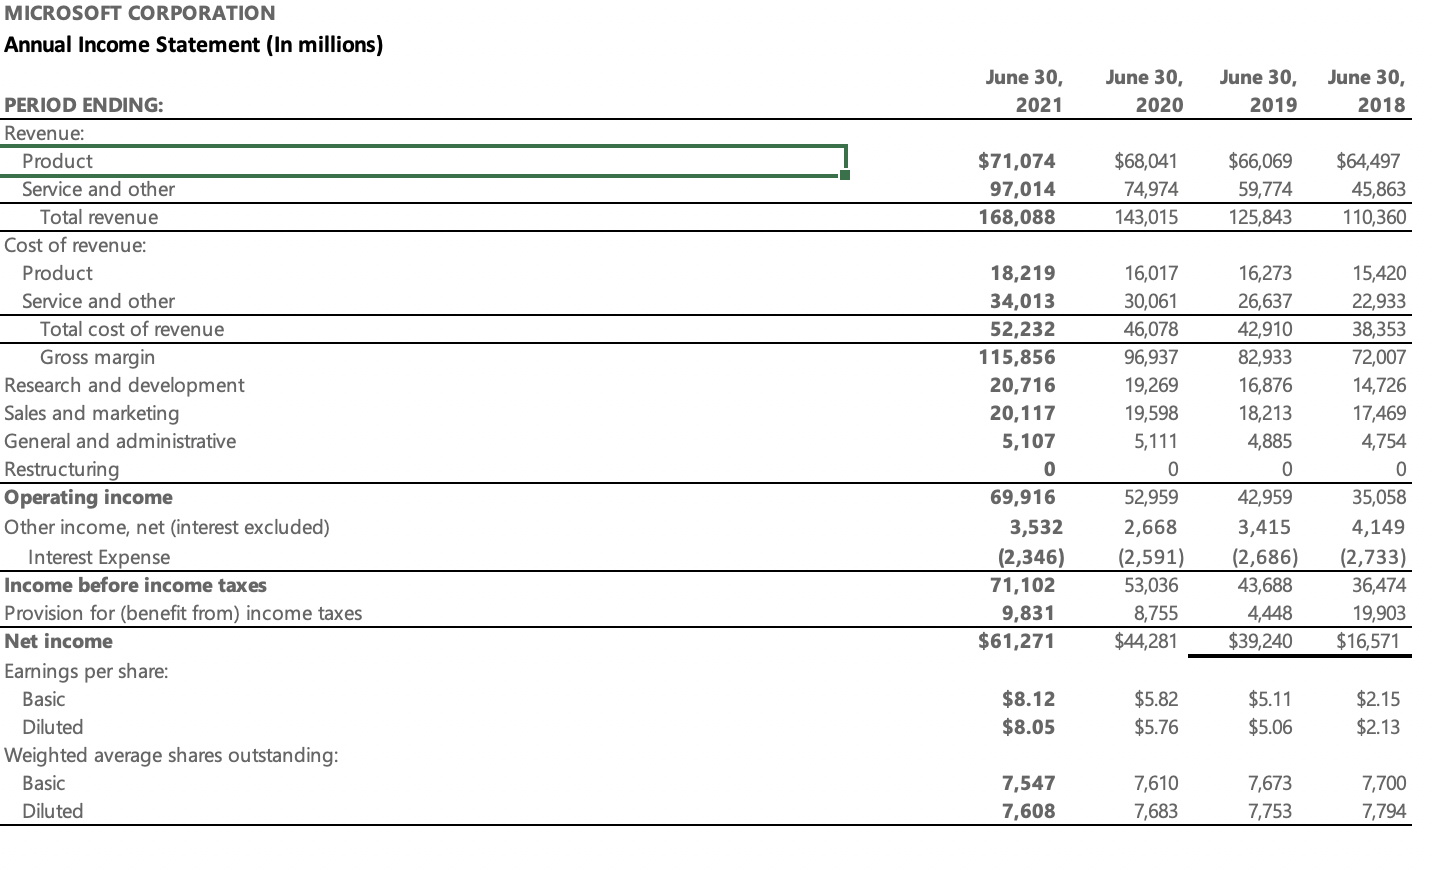
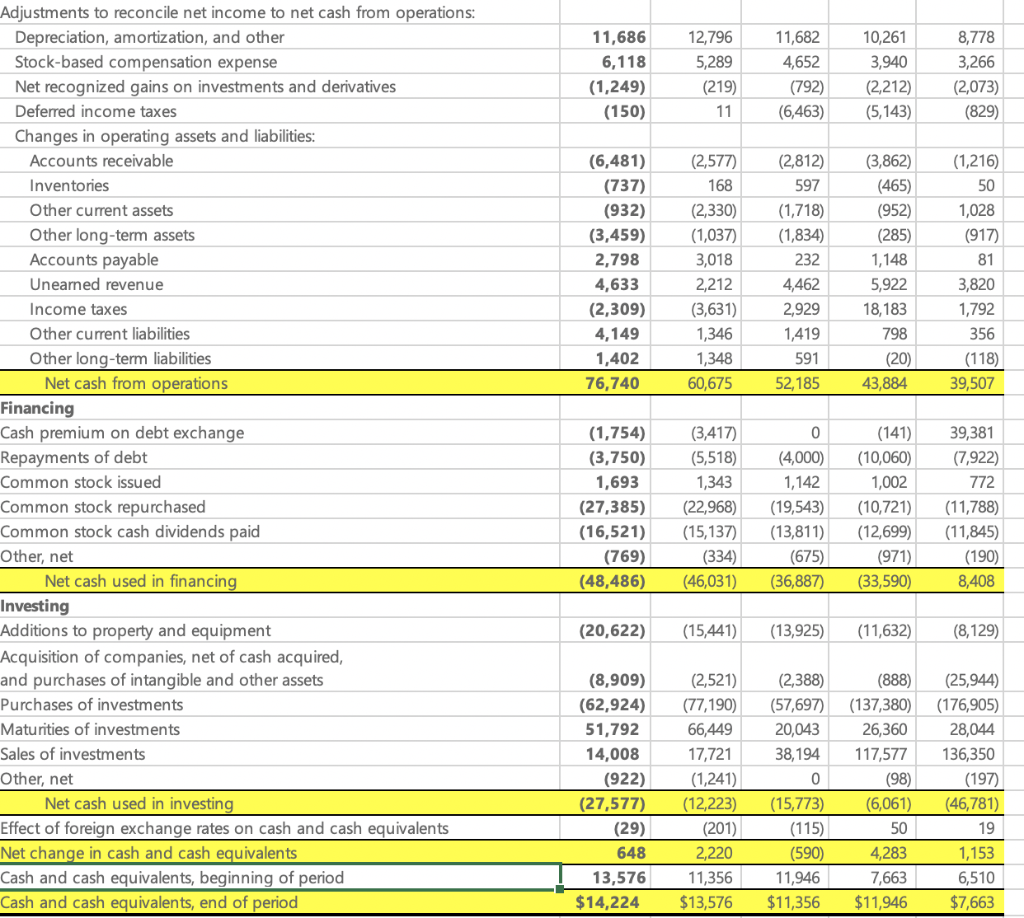
CREDIT RISK ANALYSIS: MICROSOFT (1) 2021 (2) 2020 (3) 2019 % Changes (21-20) % Changes (20-19 COVERAGE Time Interest Earned EBITDA Coverage Cash from operations to total debt Free Operating Cash Flow to Total Debt LIQUIDITY Current Ratio Quick Ratio SOLVENCY Liabilities-to-Equity Ratio Total Debt to Equity Ratio AAA AAA AAA Credit Rating Recommendations: 59,715 11,088 5,984 49,711 7,800 15,075 $333,779 44,151 8,753 2,965 43,351 7,038 13,138 $301,311 36,477 7,379 2,649 42,026 7,750 14,723 $286,556 29,460 6,686 1,862 35,683 8,053 7,442 $258,848 Property and equipment, net of accumulated depreciation of: $51,351 (2021); $43,197 (2020); $35,330 (2019); $29,223 (2018) Operating lease right-of-use assets Equity investments Goodwill Intangible assets, net Other long-term assets Total assets Liabilities and stockholders' equity Current liabilities: Accounts payable Short-term debt Current portion of long-term debt Accrued compensation Short-term income taxes Short-term unearned revenue Other current liabilities Total current liabilities Long-term debt Long-term income taxes Long-term unearned revenue Deferred income taxes Operating lease liabilities Other long-term liabilities Total liabilities Commitments and contingencies Stockholders' equity: Common stock and paid-in capital - shares authorized 24,000; outstanding: 7,519 (2021); 7,571 (2020); 7,643 (2019); 7,677 (2018) Retained earnings Accumulated other comprehensive income (loss) Total stockholders' equity Total liabilities and stockholders' equity $15,163 0 8,072 10,057 2,174 41,525 11,666 88,657 50,074 27,190 2,616 198 9,629 13,427 191,791 $12,530 0 3,749 7,874 2,130 36,000 10,027 72,310 59,578 29,432 3,180 204 7,671 10,632 183,007 $9,382 0 5,516 6,830 5,665 32,676 9,351 69,420 66,662 29,612 4,530 233 6,188 7,581 184,226 $8,617 0 3,998 6,103 2,121 28,905 8,744 58,488 72,242 30,265 3,815 541 5,568 5,211 176,130 83,111 57,055 1,822 141,988 $333,779 80,552 34,566 3,186 118,304 $301,311 78,520 24,150 (340) 102,330 $286,556 71,223 13,682 -2,187 82,718 $258,848 MICROSOFT CORPORATION Annual Income Statement (In millions) June 30, 2021 June 30, 2020 June 30, 2019 June 30, 2018 $71,074 97,014 168,088 $68,041 74,974 143,015 $66,069 59,774 125,843 $64,497 45,863 110,360 PERIOD ENDING: Revenue: Product Service and other Total revenue Cost of revenue: Product Service and other Total cost of revenue Gross margin Research and development Sales and marketing General and administrative Restructuring Operating income Other income, net interest excluded) Interest Expense Income before income taxes Provision for (benefit from) income taxes Net income Earnings per share: Basic Diluted Weighted average shares outstanding: Basic Diluted 18,219 34,013 52,232 115,856 20,716 20,117 5,107 0 69,916 3,532 (2,346) 71,102 9,831 $61,271 16,017 30,061 46,078 96,937 19,269 19,598 5,111 0 52,959 2,668 (2,591) 53,036 8,755 $44,281 16,273 26,637 42,910 82,933 16,876 18,213 4,885 0 42,959 3,415 (2,686) 43,688 4,448 $39,240 15,420 22,933 38,353 72,007 14,726 17,469 4,754 0 35,058 4,149 (2,733) 36,474 19,903 $16,571 $8.12 $8.05 $5.82 $5.76 $5.11 $5.06 $2.15 $2.13 7,547 7,608 7,610 7,683 7,673 7,753 7,700 7,794 11,686 6,118 (1,249) (150) 12,796 5,289 (219) 11 11,682 4,652 (792) (6,463) 10,261 3,940 (2,212) (5,143) 8,778 3,266 (2,073) (829) (6,481) (737) (932) (3,459) 2,798 4,633 (2,309) 4,149 1,402 76,740 (2,577) 168 (2,330) (1,037) 3,018 2,212 (3,631) 1,346 1,348 60,675 (2,812) 597 (1,718) (1,834) 232 4,462 2,929 1,419 591 52,185 (3,862) (465) (952) (285) 1,148 5,922 18,183 798 (20) 43,884 (1,216) 50 1,028 (917) 81 3,820 1,792 356 (118) 39,507 0 Adjustments to reconcile net income to net cash from operations: Depreciation, amortization, and other Stock-based compensation expense Net recognized gains on investments and derivatives Deferred income taxes Changes in operating assets and liabilities: Accounts receivable Inventories Other current assets Other long-term assets Accounts payable Uneamed revenue Income taxes Other current liabilities Other long-term liabilities Net cash from operations Financing Cash premium on debt exchange Repayments of debt Common stock issued Common stock repurchased Common stock cash dividends paid Other, net Net cash used in financing Investing Additions to property and equipment Acquisition of companies, net of cash acquired, and purchases of intangible and other assets Purchases of investments Maturities of investments Sales of investments Other, net Net cash used in investing Effect of foreign exchange rates on cash and cash equivalents Net change in cash and cash equivalents Cash and cash equivalents, beginning of period Cash and cash equivalents, end of period (1,754) (3,750) 1,693 (27,385) (16,521) (769) (48,486) (3,417) (5,518) 1,343 (22,968) (15,137) (334) (46,031) (4,000) 1,142 (19,543) (13,811) (675) (36,887) (141) (10,060) 1,002 (10,721) (12,699) (971) (33,590) 39,381 (7,922) 772 (11,788) (11,845) (190) 8,408 (20,622) (15,441) (13,925) (11,632) (8,129) (8,909) (62,924) 51,792 14,008 (922) (27,577) (2,521) (77,190) 66,449 17,721 (1,241) (12,223) (201) (2,388) (57,697) 20,043 38,194 0 (15,773) (888) (137,380) 26,360 117,577 (98) (6,061) 50 4,283 7,663 $11,946 (25,944) (176,905) 28,044 136,350 (197) (46,781) 19 1,153 6,510 $7,663 (29) (115) 2,220 648 13,576 $14,224 11,356 $13,576 (590) 11,946 $11,356 CREDIT RISK ANALYSIS: MICROSOFT (1) 2021 (2) 2020 (3) 2019 % Changes (21-20) % Changes (20-19 COVERAGE Time Interest Earned EBITDA Coverage Cash from operations to total debt Free Operating Cash Flow to Total Debt LIQUIDITY Current Ratio Quick Ratio SOLVENCY Liabilities-to-Equity Ratio Total Debt to Equity Ratio AAA AAA AAA Credit Rating Recommendations: 59,715 11,088 5,984 49,711 7,800 15,075 $333,779 44,151 8,753 2,965 43,351 7,038 13,138 $301,311 36,477 7,379 2,649 42,026 7,750 14,723 $286,556 29,460 6,686 1,862 35,683 8,053 7,442 $258,848 Property and equipment, net of accumulated depreciation of: $51,351 (2021); $43,197 (2020); $35,330 (2019); $29,223 (2018) Operating lease right-of-use assets Equity investments Goodwill Intangible assets, net Other long-term assets Total assets Liabilities and stockholders' equity Current liabilities: Accounts payable Short-term debt Current portion of long-term debt Accrued compensation Short-term income taxes Short-term unearned revenue Other current liabilities Total current liabilities Long-term debt Long-term income taxes Long-term unearned revenue Deferred income taxes Operating lease liabilities Other long-term liabilities Total liabilities Commitments and contingencies Stockholders' equity: Common stock and paid-in capital - shares authorized 24,000; outstanding: 7,519 (2021); 7,571 (2020); 7,643 (2019); 7,677 (2018) Retained earnings Accumulated other comprehensive income (loss) Total stockholders' equity Total liabilities and stockholders' equity $15,163 0 8,072 10,057 2,174 41,525 11,666 88,657 50,074 27,190 2,616 198 9,629 13,427 191,791 $12,530 0 3,749 7,874 2,130 36,000 10,027 72,310 59,578 29,432 3,180 204 7,671 10,632 183,007 $9,382 0 5,516 6,830 5,665 32,676 9,351 69,420 66,662 29,612 4,530 233 6,188 7,581 184,226 $8,617 0 3,998 6,103 2,121 28,905 8,744 58,488 72,242 30,265 3,815 541 5,568 5,211 176,130 83,111 57,055 1,822 141,988 $333,779 80,552 34,566 3,186 118,304 $301,311 78,520 24,150 (340) 102,330 $286,556 71,223 13,682 -2,187 82,718 $258,848 MICROSOFT CORPORATION Annual Income Statement (In millions) June 30, 2021 June 30, 2020 June 30, 2019 June 30, 2018 $71,074 97,014 168,088 $68,041 74,974 143,015 $66,069 59,774 125,843 $64,497 45,863 110,360 PERIOD ENDING: Revenue: Product Service and other Total revenue Cost of revenue: Product Service and other Total cost of revenue Gross margin Research and development Sales and marketing General and administrative Restructuring Operating income Other income, net interest excluded) Interest Expense Income before income taxes Provision for (benefit from) income taxes Net income Earnings per share: Basic Diluted Weighted average shares outstanding: Basic Diluted 18,219 34,013 52,232 115,856 20,716 20,117 5,107 0 69,916 3,532 (2,346) 71,102 9,831 $61,271 16,017 30,061 46,078 96,937 19,269 19,598 5,111 0 52,959 2,668 (2,591) 53,036 8,755 $44,281 16,273 26,637 42,910 82,933 16,876 18,213 4,885 0 42,959 3,415 (2,686) 43,688 4,448 $39,240 15,420 22,933 38,353 72,007 14,726 17,469 4,754 0 35,058 4,149 (2,733) 36,474 19,903 $16,571 $8.12 $8.05 $5.82 $5.76 $5.11 $5.06 $2.15 $2.13 7,547 7,608 7,610 7,683 7,673 7,753 7,700 7,794 11,686 6,118 (1,249) (150) 12,796 5,289 (219) 11 11,682 4,652 (792) (6,463) 10,261 3,940 (2,212) (5,143) 8,778 3,266 (2,073) (829) (6,481) (737) (932) (3,459) 2,798 4,633 (2,309) 4,149 1,402 76,740 (2,577) 168 (2,330) (1,037) 3,018 2,212 (3,631) 1,346 1,348 60,675 (2,812) 597 (1,718) (1,834) 232 4,462 2,929 1,419 591 52,185 (3,862) (465) (952) (285) 1,148 5,922 18,183 798 (20) 43,884 (1,216) 50 1,028 (917) 81 3,820 1,792 356 (118) 39,507 0 Adjustments to reconcile net income to net cash from operations: Depreciation, amortization, and other Stock-based compensation expense Net recognized gains on investments and derivatives Deferred income taxes Changes in operating assets and liabilities: Accounts receivable Inventories Other current assets Other long-term assets Accounts payable Uneamed revenue Income taxes Other current liabilities Other long-term liabilities Net cash from operations Financing Cash premium on debt exchange Repayments of debt Common stock issued Common stock repurchased Common stock cash dividends paid Other, net Net cash used in financing Investing Additions to property and equipment Acquisition of companies, net of cash acquired, and purchases of intangible and other assets Purchases of investments Maturities of investments Sales of investments Other, net Net cash used in investing Effect of foreign exchange rates on cash and cash equivalents Net change in cash and cash equivalents Cash and cash equivalents, beginning of period Cash and cash equivalents, end of period (1,754) (3,750) 1,693 (27,385) (16,521) (769) (48,486) (3,417) (5,518) 1,343 (22,968) (15,137) (334) (46,031) (4,000) 1,142 (19,543) (13,811) (675) (36,887) (141) (10,060) 1,002 (10,721) (12,699) (971) (33,590) 39,381 (7,922) 772 (11,788) (11,845) (190) 8,408 (20,622) (15,441) (13,925) (11,632) (8,129) (8,909) (62,924) 51,792 14,008 (922) (27,577) (2,521) (77,190) 66,449 17,721 (1,241) (12,223) (201) (2,388) (57,697) 20,043 38,194 0 (15,773) (888) (137,380) 26,360 117,577 (98) (6,061) 50 4,283 7,663 $11,946 (25,944) (176,905) 28,044 136,350 (197) (46,781) 19 1,153 6,510 $7,663 (29) (115) 2,220 648 13,576 $14,224 11,356 $13,576 (590) 11,946 $11,356