Question
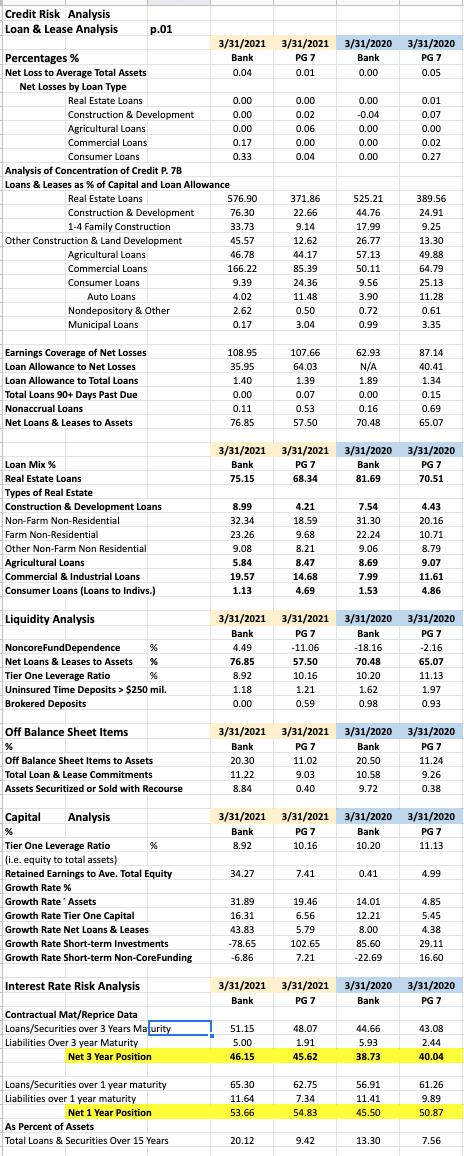
Credit Risk: On the excel spreadsheet risk analysis at the top, see credit risk analysis. Analyze the differences between the Bank and the PG7 in
Credit Risk: On the excel spreadsheet risk analysis at the top, see credit risk analysis. Analyze the differences between the Bank and the PG7 in 2021 by looking at differences in loan mix, net loan losses, differences in the concentration ratios for different types of loans, earnings coverage of net losses, loan allowance to net losses and to total loans, non-accrual loans, and net loans and leases. Does the Bank have more or less credit risk than the PG7 in 2021
Liquidity and OBS Risk: Scroll down the spreadsheet to see the Liquidity Analysis ratios. Analyze the differences between the Bank and the PG7 in 2021 by looking at differences in liquidity risk from an asset, liability, and off-balance sheet risk perspective. Does the Bank have more or less liquidity risk than the PG7 in 2021?
Capital Risk: Scroll down the spreadsheet to see the Capital Analysis ratios. Analyze the differences between the Bank and the PG7 in 2021 by looking at differences in the Tier One Leverage ratio, retained earnings to average total equity ratio, and by comparing the growth rate in assets and loans to the growth rate in the capital. Does the Bank have more or less capital risk than the PG7 in 2021?
Interest Rate Risk: Scroll down the spreadsheet to see the Interest Rate Risk Analysis ratios. Analyze the differences between the Bank and the PG7 in 2021 by looking at differences in the Net 3 Year and Net 1 Year Positions (larger more interest rate risk; note positive positions imply negative funding gaps since there are more long-term assets than long-term liabilities, i.e. so more rate sensitive liabilities. Does the Bank have more or less liquidity interest rate risk than the PG7 in 2021?

Credit Risk Analysis Loan & Lease Analysis p.01 Percentages % Net Loss to Average Total Assets Net Losses by Loan Type Real Estate Loans Construction & Development Agricultural Loans Commercial Loans Consumer Loans Analysis of Concentration of Credit P. 7B Loans & Leases as % of Capital and Loan Allowance Real Estate Loans Construction & Development 1-4 Family Construction Other Construction & Land Development Agricultural Loans Commercial Loans Consumer Loans Auto Loans Nondepository & Other Municipal Loans Earnings Coverage of Net Losses Loan Allowance to Net Losses Loan Allowance to Total Loans Total Loans 90+ Days Past Due Nonaccrual Loans Net Loans & Leases to Assets Loan Mix % Real Estate Loans Types of Real Estate Construction & Development Loans Non-Farm Non-Residential Farm Non-Residential Other Non-Farm Non Residential Agricultural Loans Commercial & Industrial Loans Consumer Loans (Loans to Indivs.) Liquidity Analysis NoncoreFundDependence % Net Loans & Leases to Assets % Tier One Leverage Ratio % Uninsured Time Deposits > $250 mil. Brokered Deposits Off Balance Sheet Items % Off Balance Sheet Items to Assets Total Loan & Lease Commitments Assets Securitized or Sold with Recourse Capital Analysis % Tier One Leverage Ratio (i.e. equity to total assets) % Retained Earnings to Ave. Total Equi Growth Rate % Growth Rate Assets Growth Rate Tier One Capital Growth Rate Net Loans & Leases Growth Rate Short-term Investments Growth Rate Short-term Non-CoreFunding Interest Rate Risk Analysis Contractual Mat/Reprice Data Loans/Securities over 3 Years Maturity Liabilities Over 3 year Maturity Net 3 Year Position Loans/Securities over 1 year maturity Liabilities over 1 year maturity Net 1 Year Position 3/31/2021 Bank 0.04 As Percent of Assets Total Loans & Securities Over 15 Years 0.00 0.00 0.00 0.17 0.33 576.90 76.30 33.73 45.57 46.78 166.22 9.39 4.02 2.62 0.17 108.95 35.95 1.40 0.00 0.11 76.85 3/31/2021 Bank 75.15 8.99 32.34 23.26 9.08 5.84 19.57 1.13 34.27 31.89 16.31 43.83 -78.65 -6.86 3/31/2021 PG 7 0.01 0.00 0.02 0.06 0.00 0.04 51.15 5.00 46.15 371.86 22.66 9.14 12.62 44.17 85.39 24.36 11.48 0.50 3.04 65.30 11.64 53.66 107.66 64.03 1.39 0.07 3/31/2021 3/31/2021 Bank PG 7 4.49 -11.06 76.85 57.50 8.92 1.18 0.00 20.12 0.53 57.50 3/31/2021 PG 7 68.34 3/31/2021 3/31/2021 Bank PG 7 20.30 11.02 11.22 9.03 8.84 0.40 4.21 18.59 9.68 8.21 3/31/2021 3/31/2021 Bank PG 7 8.92 10.16 8.47 14.68 4.69 10.16 1.21 0.59 3/31/2021 3/31/2021 Bank PG 7 7.41 19.46 6.56 5.79 102.65 7.21 48.07 1.91 45.62 62.75 7.34 54.83 9.42 3/31/2020 Bank 0.00 3/31/2020 PG 7 0.05 ***** *99* **************** ******* b**** 1888** ***** bi m** bom ben barebom: bu i: *** *** I
Step by Step Solution
3.43 Rating (156 Votes )
There are 3 Steps involved in it
Step: 1
the credit risk analysis based on the provided description Heres a breakdown of the analysis you requested for each section Credit Risk Loan Mix Compare the percentage of each loan type eg real estate ...
Get Instant Access to Expert-Tailored Solutions
See step-by-step solutions with expert insights and AI powered tools for academic success
Step: 2

Step: 3

Ace Your Homework with AI
Get the answers you need in no time with our AI-driven, step-by-step assistance
Get Started


