Crosstabs In order to analyze categorical variables, chi-square utilizes frequencies. These are outlined in a cross tabs table, and show how one variable is

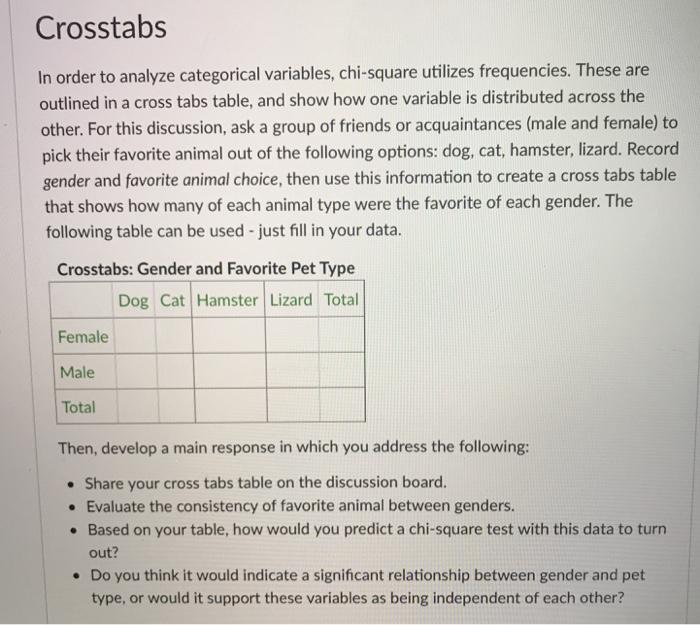
Crosstabs In order to analyze categorical variables, chi-square utilizes frequencies. These are outlined in a cross tabs table, and show how one variable is distributed across the other. For this discussion, ask a group of friends or acquaintances (male and female) to pick their favorite animal out of the following options: dog, cat, hamster, lizard. Record gender and favorite animal choice, then use this information to create a cross tabs table that shows how many of each animal type were the favorite of each gender. The following table can be used - just fill in your data. Crosstabs: Gender and Favorite Pet Type Female Male Total Dog Cat Hamster Lizard Total Then, develop a main response in which you address the following: Share your cross tabs table on the discussion board. Evaluate the consistency of favorite animal between genders. Based on your table, how would you predict a chi-square test with this data to turn out? Do you think it would indicate a significant relationship between gender and pet type, or would it support these variables as being independent of each other?
Step by Step Solution
There are 3 Steps involved in it
Step: 1
Heres an example of a cross tabs table showing the distribution of favorite pet types among males an...
See step-by-step solutions with expert insights and AI powered tools for academic success
Step: 2

Step: 3

Ace Your Homework with AI
Get the answers you need in no time with our AI-driven, step-by-step assistance
Get Started


