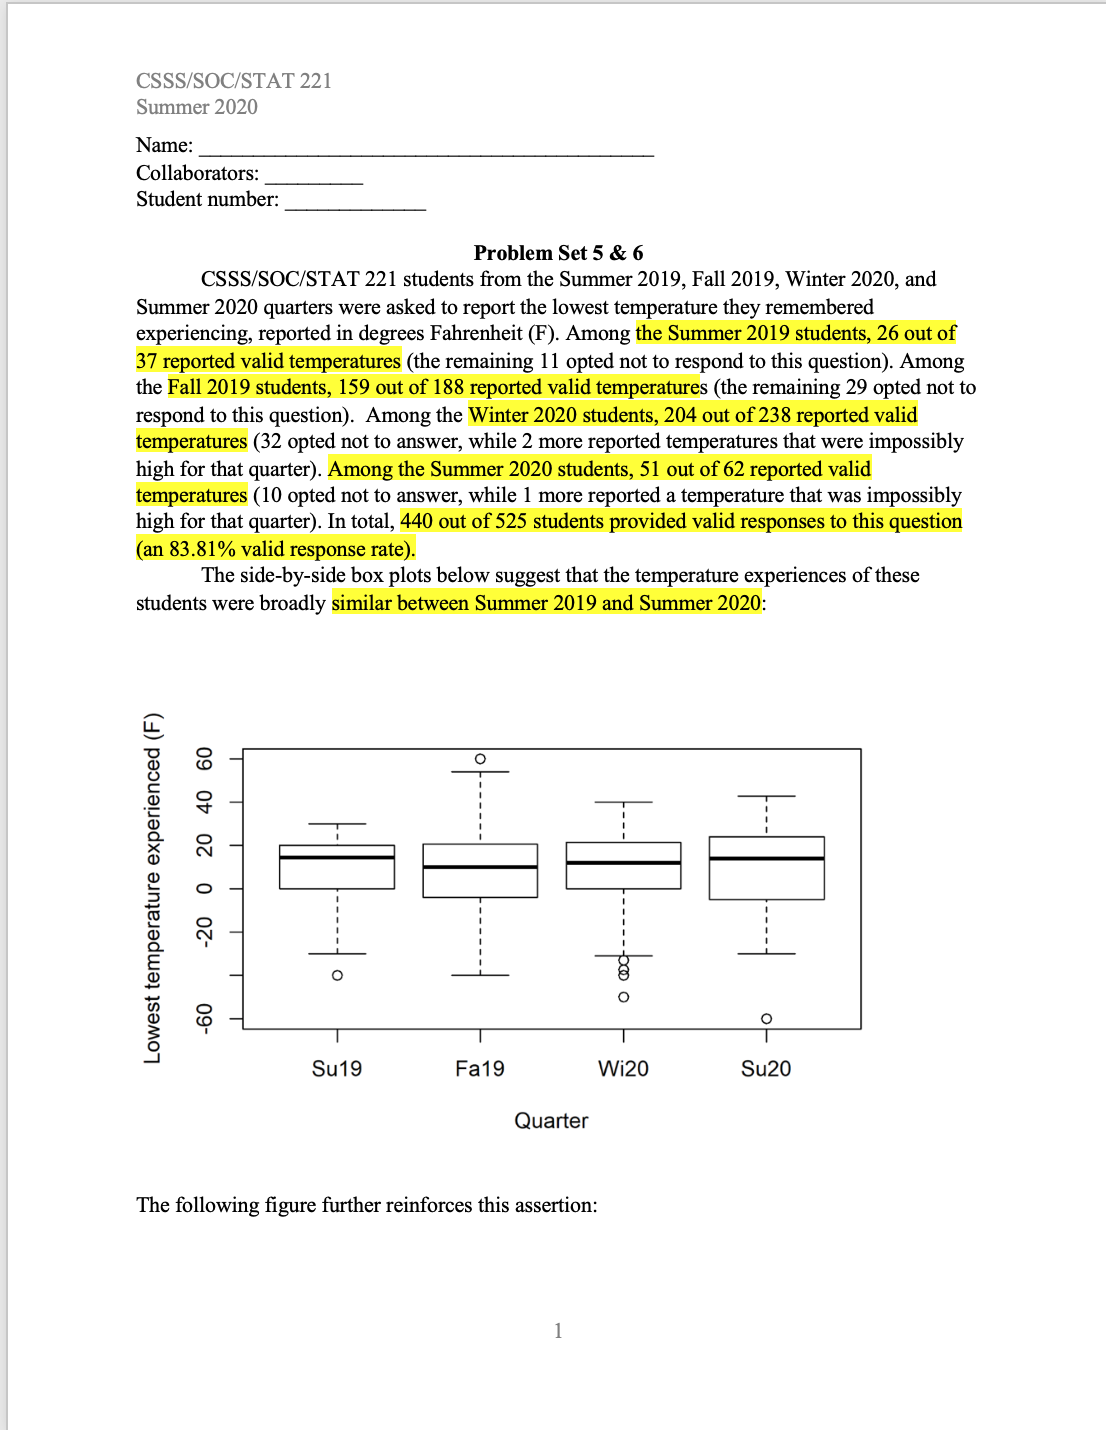
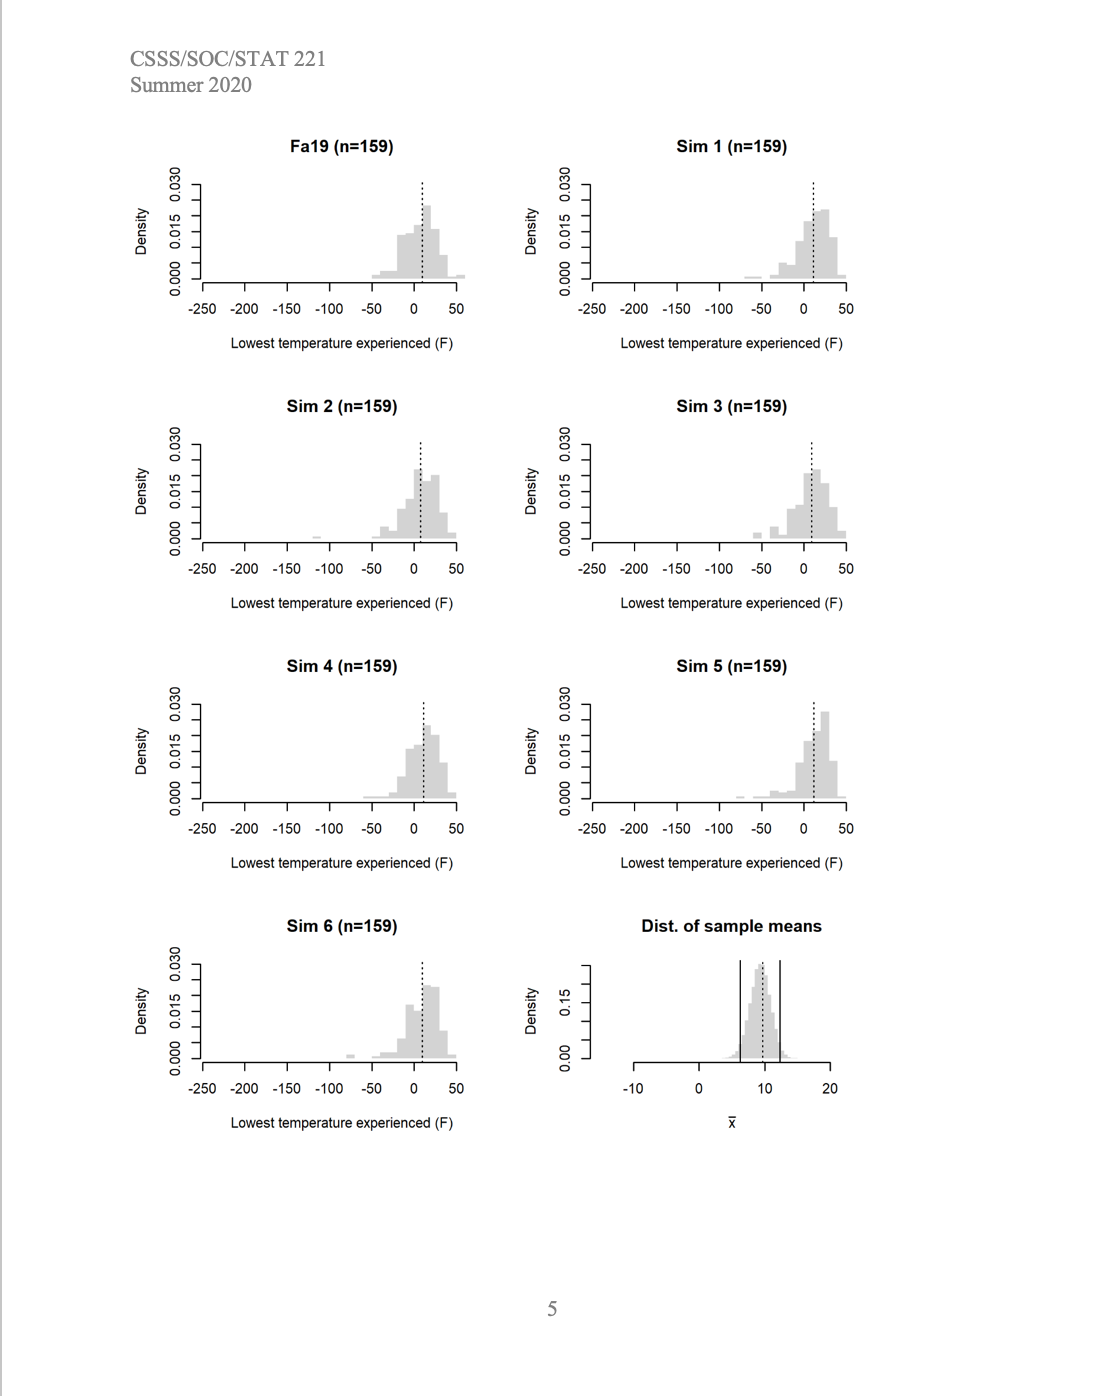
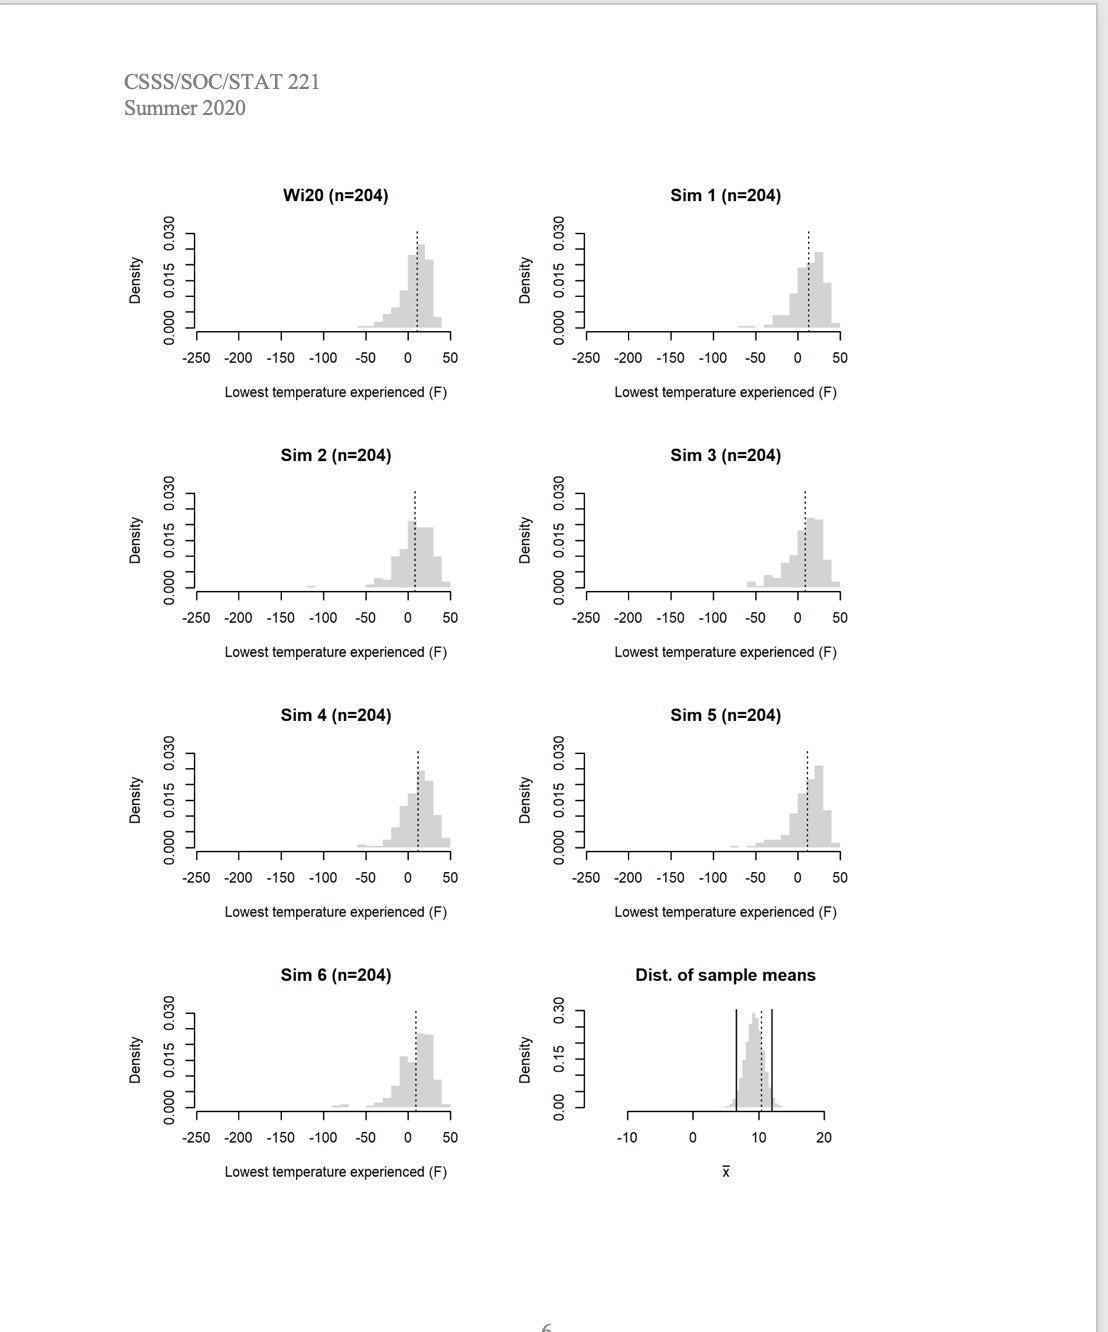
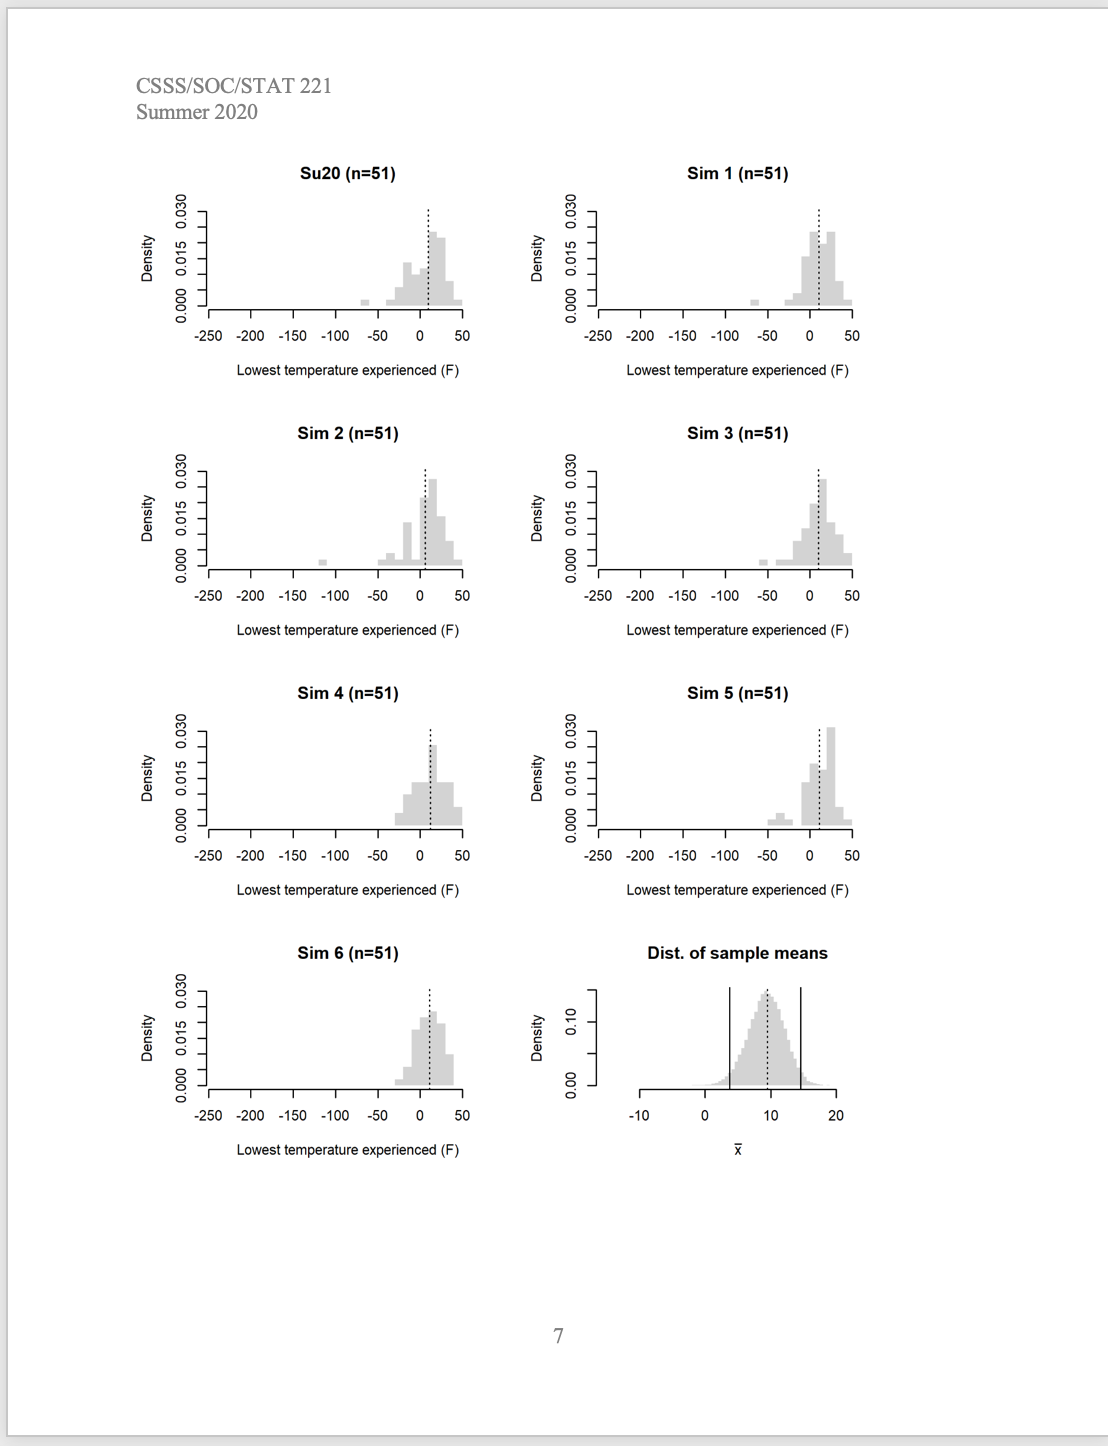
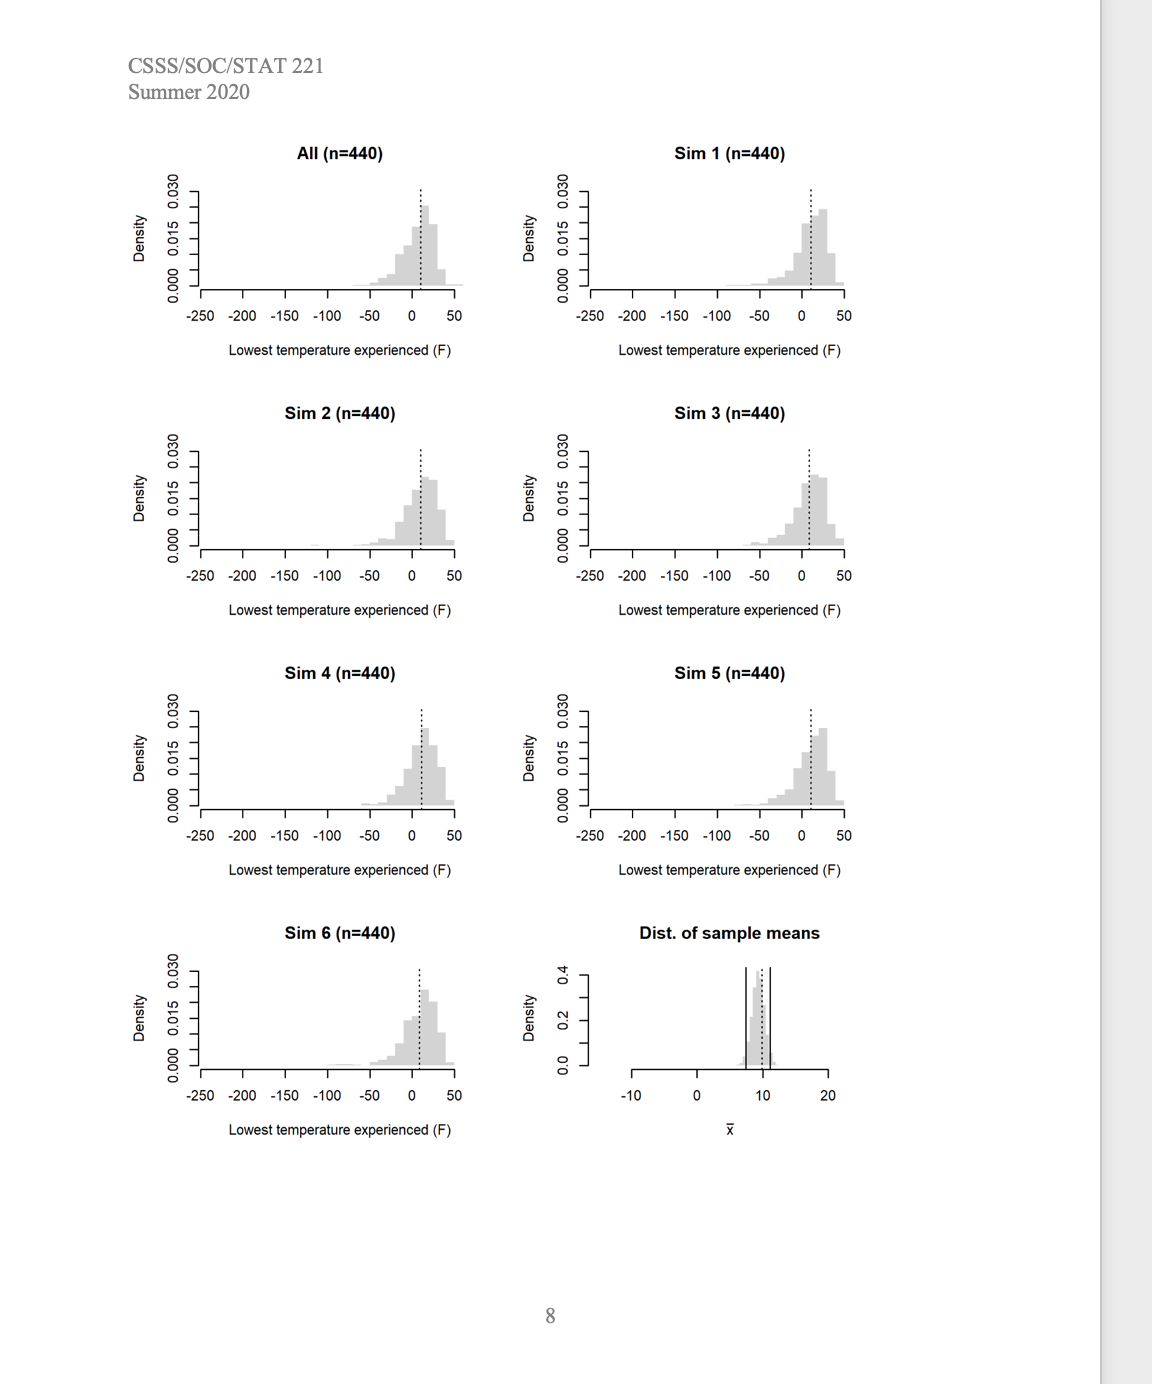
CSSS/SOC/STAT 221 students from the Summer 2019, Fall 2019, Winter 2020, and Summer 2020 quarters were asked to report the lowest temperature they remembered experiencing, reported in degrees Fahrenheit (F). Among the Summer 2019 students, 26 out of 37 reported valid temperatures (the remaining 11 opted not to respond to this question). Among the Fall 2019 students, 159 out of 188 reported valid temperatures (the remaining 29 opted not to respond to this question).Among the Winter 2020 students, 204 out of 238 reported valid temperatures (32 opted not to answer, while 2 more reported temperatures that were impossibly high for that quarter). Among the Summer 2020 students, 51 out of 62 reported valid temperatures (10 opted not to answer, while 1 more reported a temperature that was impossibly high for that quarter). In total, 440 out of 525 students provided valid responses to this question (an 83.81% valid response rate).
The side-by-side box plots below suggest that the temperature experiences of these
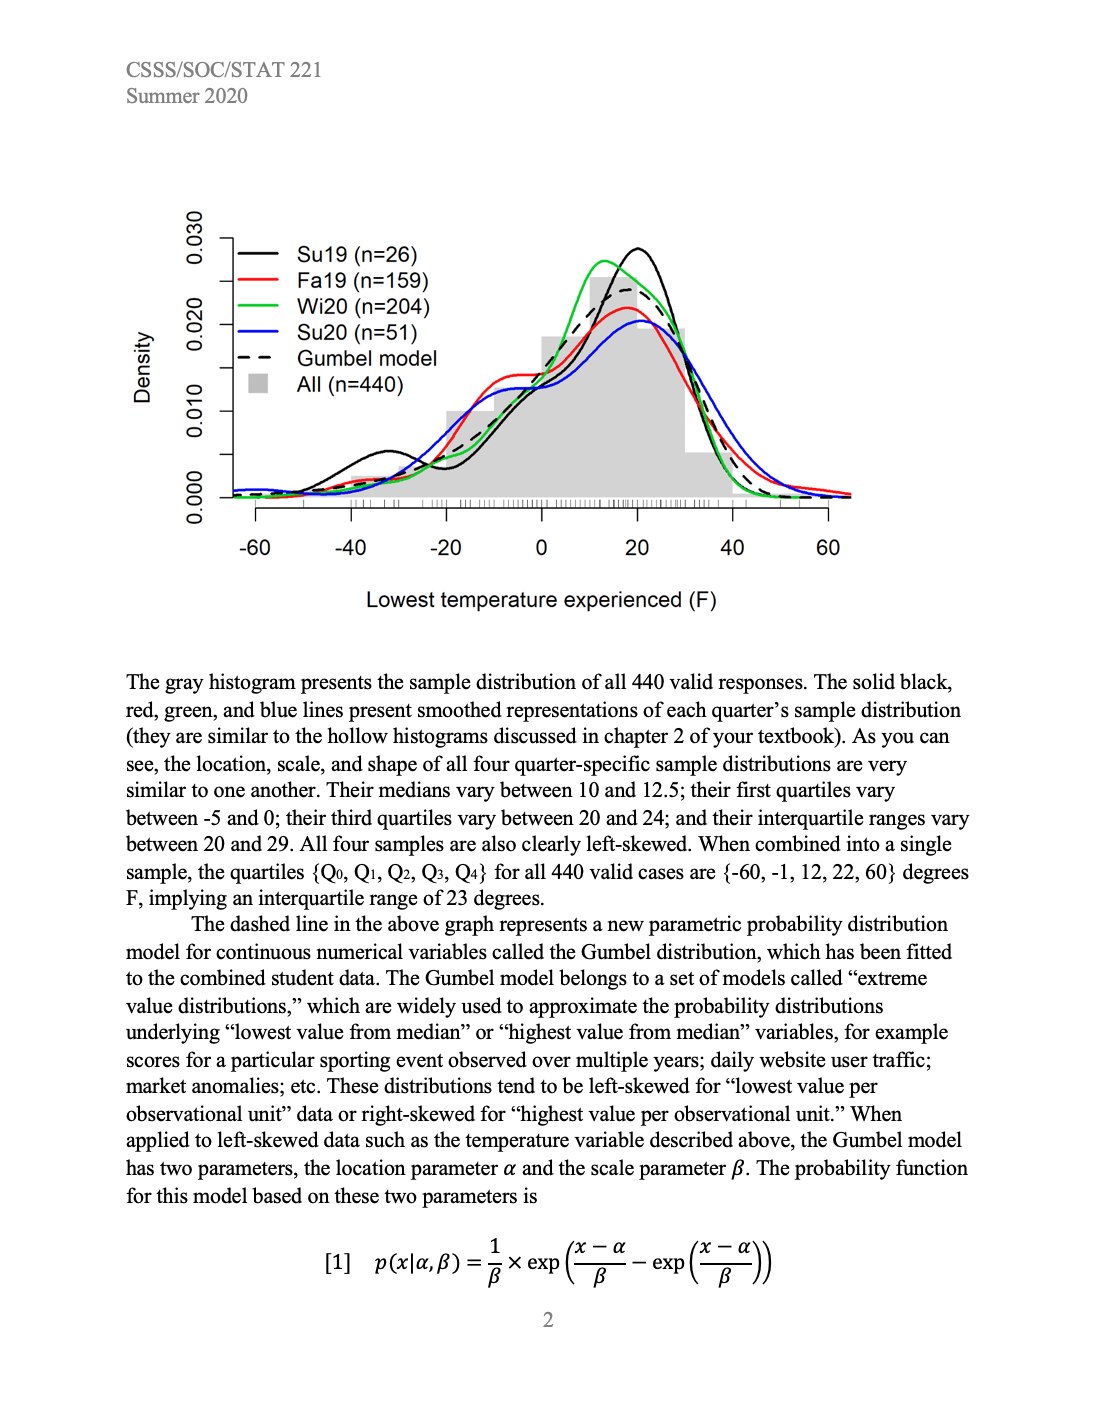
CS SS.Jr SOC} STAT 221 Summer 2020 Name' Collaborators: Student number: Problem Set 5 & 6 CS SS! SOC! STAT 221 students from the Summer 2019, Fall 2019, Winter 2020, and Summer 2020 quarters were asked to report the lowest temperature they remembered experiencing, reported in degrees Fahrenheit (F). Among the Summer 2019 students, 26 out of 37 reported valid temperatures (the remaining 11 opted not to respond to this question). Among the Fall 2019 students, 159 Out of 188 reported valid temperatures (the remaining 29 opted not to respond to this question). Among the Winter 2020 students, 204 out of 238 reported valid temperatures (32 opted not to answer, while 2 more reported temperatures that were impossibly high for that quarter). Among the Summer 2020 students, 51 out of 62 reported valid temperatures (10 opted not to answer, while 1 more reported a temperature that was impossibly high for that quarter). In total, 440 Out of 525 students provided valid responses to this question (an 83.81% valid response rate). The side-byside box plots below suggest that the temperature experiences of these students were broadly similar between Summer 2019 and Summer 2020: Q a a E a E g 8 OJ 5 D E o g 9' E .93 ;' s _' Su19 Fa19 Wi20 SUZO Quarter The following gure further reinforces this assertion: CS SS! SOC! STAT 221 Summer2020 o 8 d Su19(n=26) Fa19(n=159) 8 Wi20 (n=204) a: g Su20(n=51) g -- Gumbel model a I All (n=440) 0.000 0.010 Lowest temperature experienced (F) The gray histogram presents the sample distribution of all 440 valid responses. The solid black, red, green, and blue lines present smoothed representations of each quarter's sample distribution (they are similar to the hollow histograms discussed in chapter 2 of your textbook). As you can see, the location, scale, and shape of all four quarter-specic sample distributions are very similar to one another. Their medians vary between 10 and 12.5; their rst quartiles vary between -5 and 0; their third quartiles vary between 20 and 24; and their interquartile ranges vary between 20 and 29. All four samples are also clearly left-skewed. When combined into a single sample, the quartiles {Q0, Q1, Q2, Q3, Q4} for all 440 valid cases are {-60, -1, 12, 22, 60} degrees F, implying an interquartile range of 23 degrees. The dashed line in the above graph represents a new parametric probability distribution model for continuous numerical variables called the Gumbel distribution, which has been tted to the combined student data. The Gumbel model belongs to a set of models called \"extreme value distributions," which are widely used to appmximate the probability distributions underlying \"lowest value from median\" or \"highest value from median\" variables, for example scores for a particular sporting event observed over multiple years; daily website user trafc; market anomalies; etc. These distributions tend to be left-skewed for \"lowest value per observational unit\" data or right-skewed for \"highest value per observational unit." When applied to left-skewed data such as the temperature variable described above, the Gumbel model has two parameters, the location parameter a and the scale parameter )9. The probability function for this model based on these two parameters is 1 xa r11 pixla.)=>