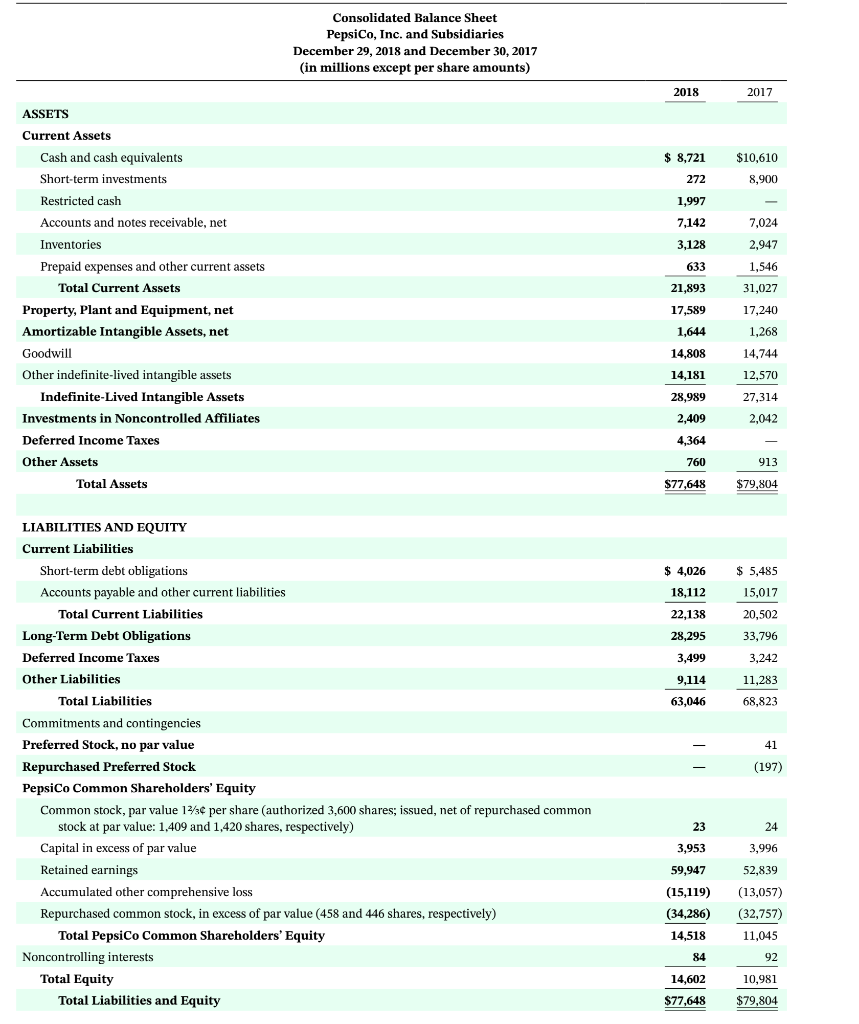
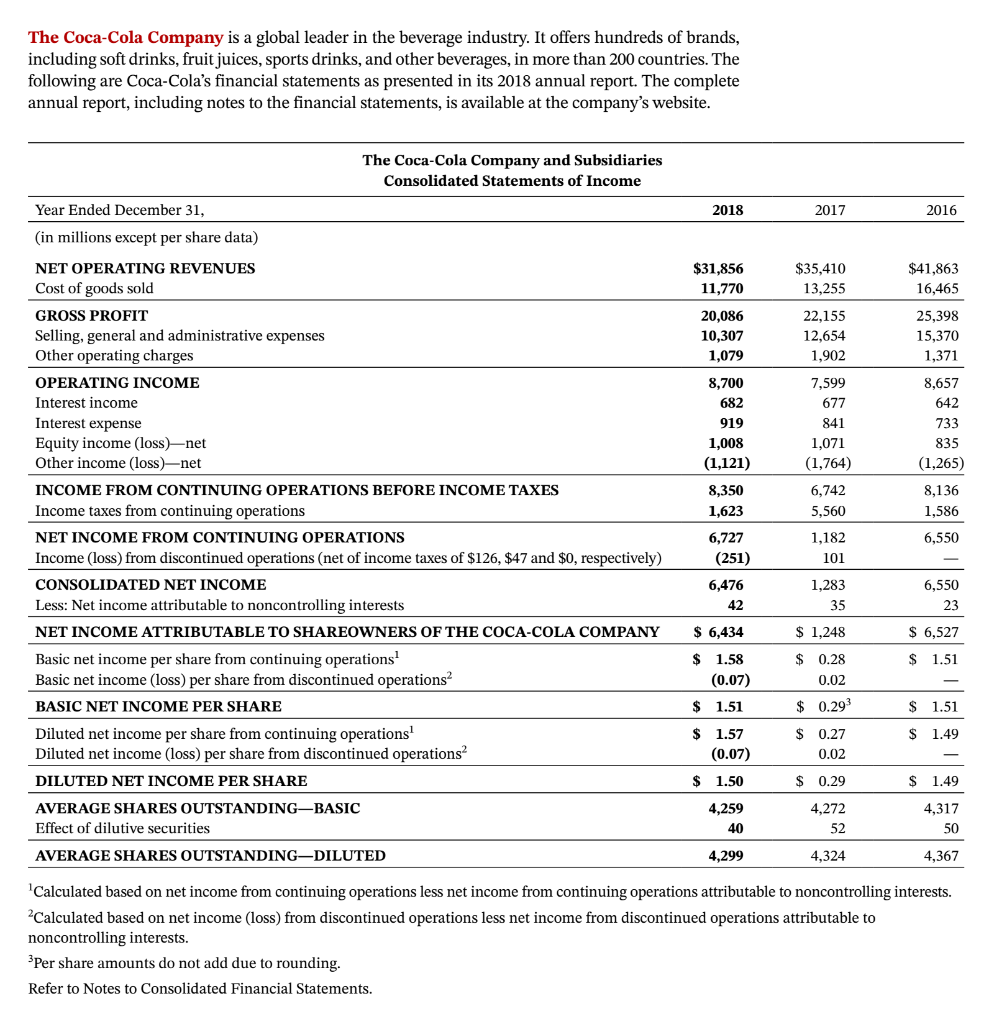
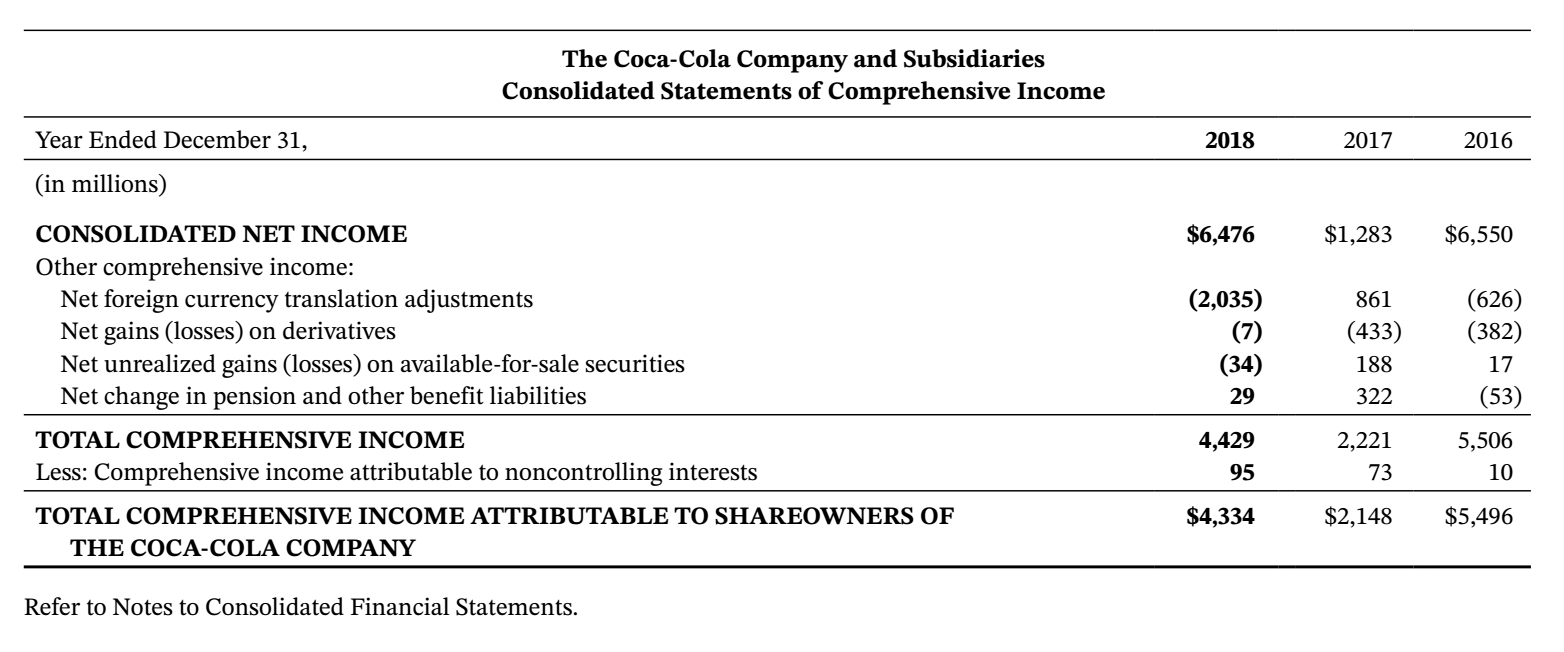
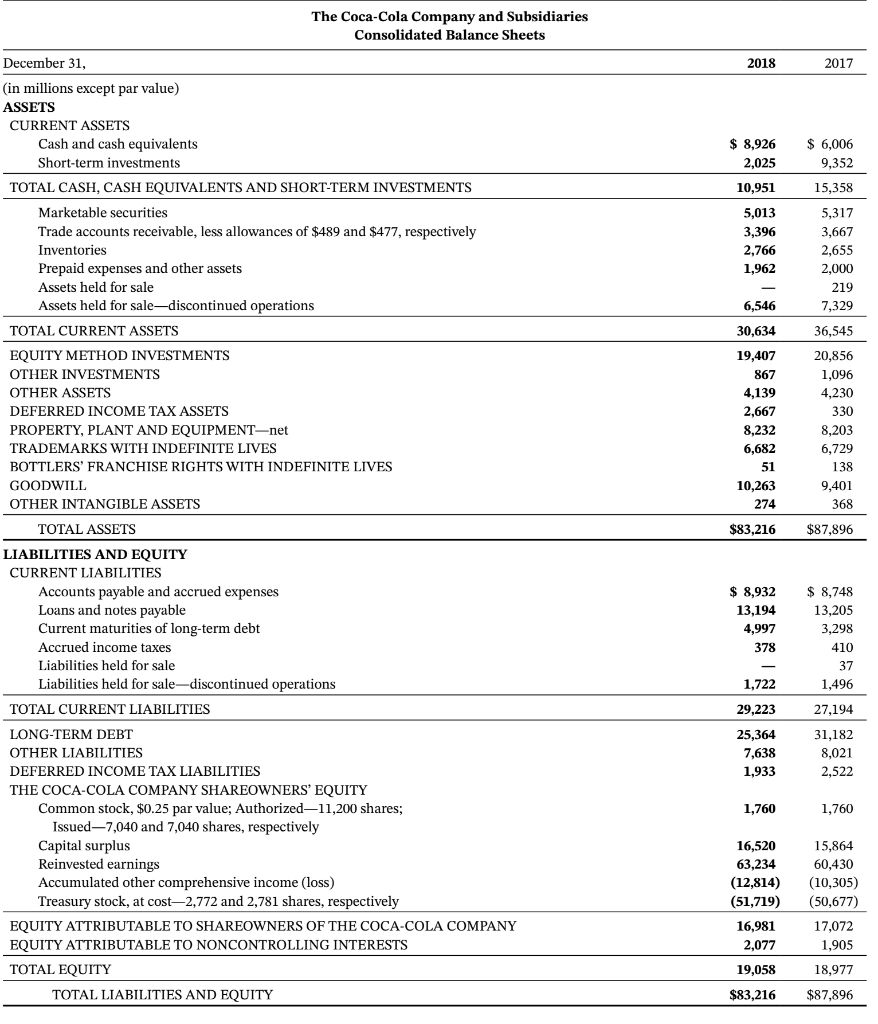
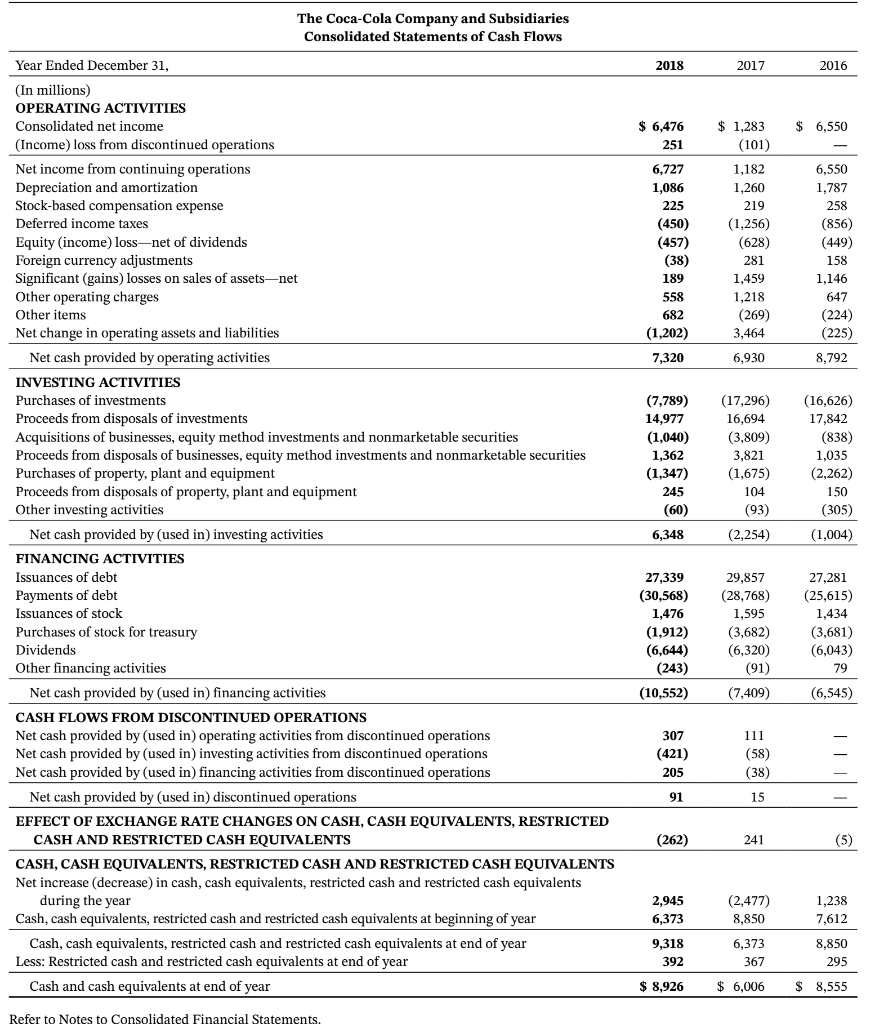
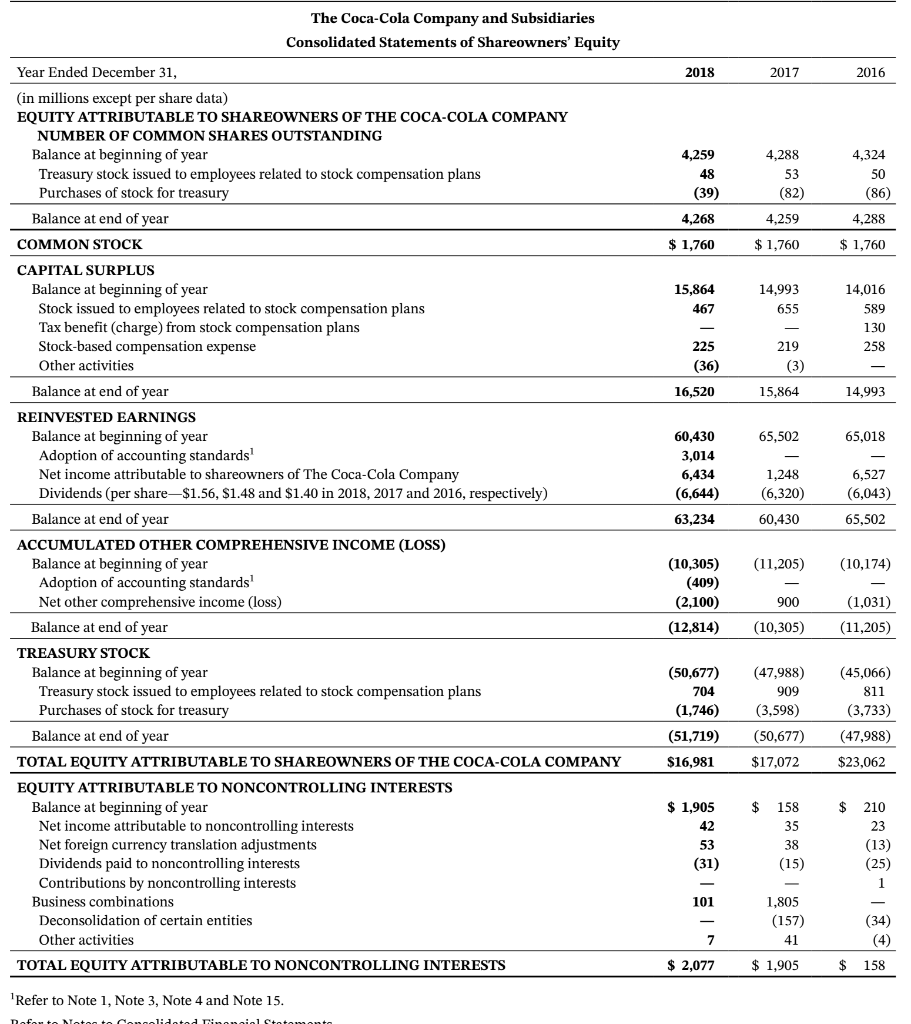
CT9.2 PepsiCo, Inc.s financial statements are presented in Appendix B. Financial statements of The Coca-Cola Company are presented in Appendix C. The complete annual reports of PepsiCo and Coca-Cola, including the notes to the financial statements, are available at each companys respective website. Instructions
a. Compute the asset turnover for each company for 2018.
b. What conclusions concerning the efficiency of assets can be drawn from these data?
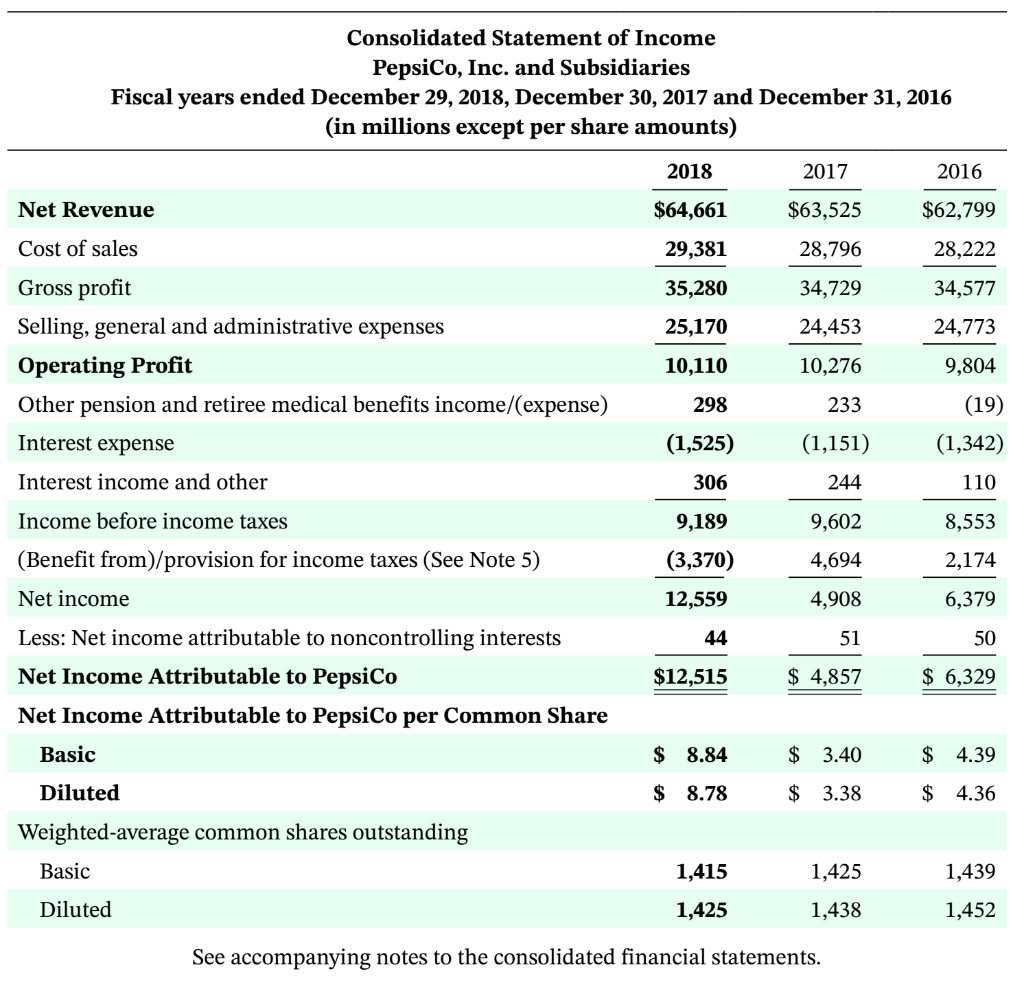
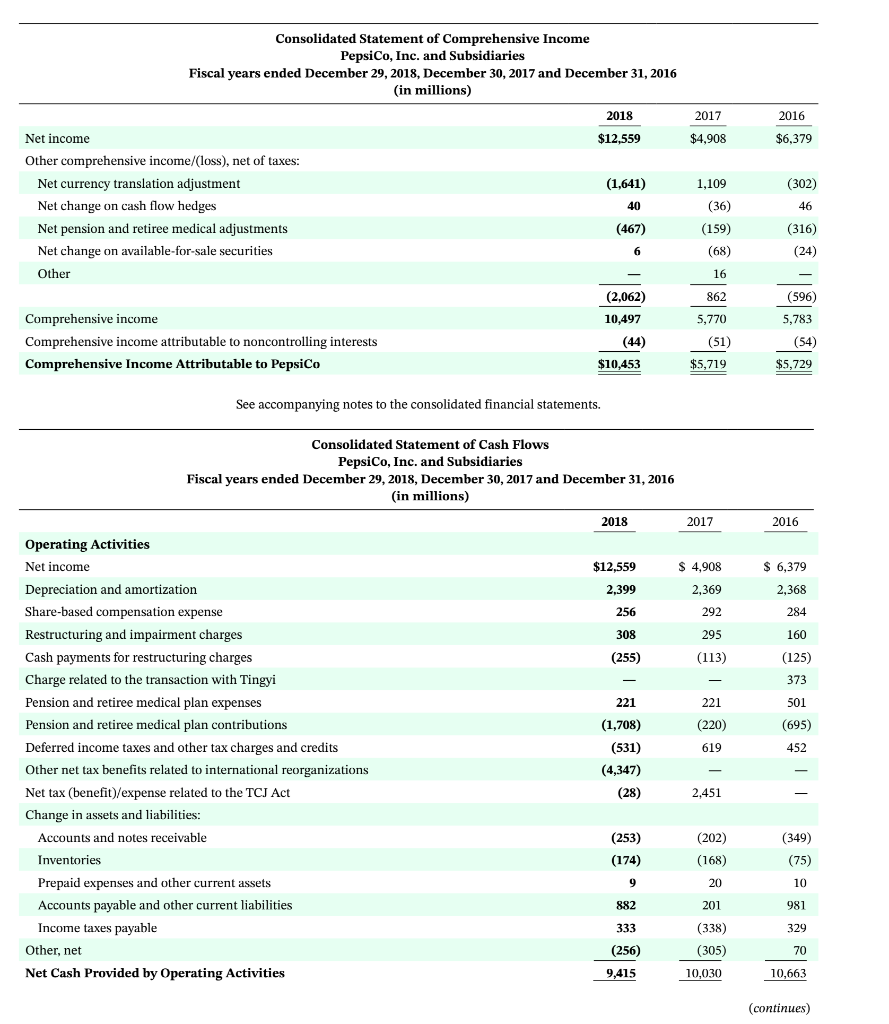
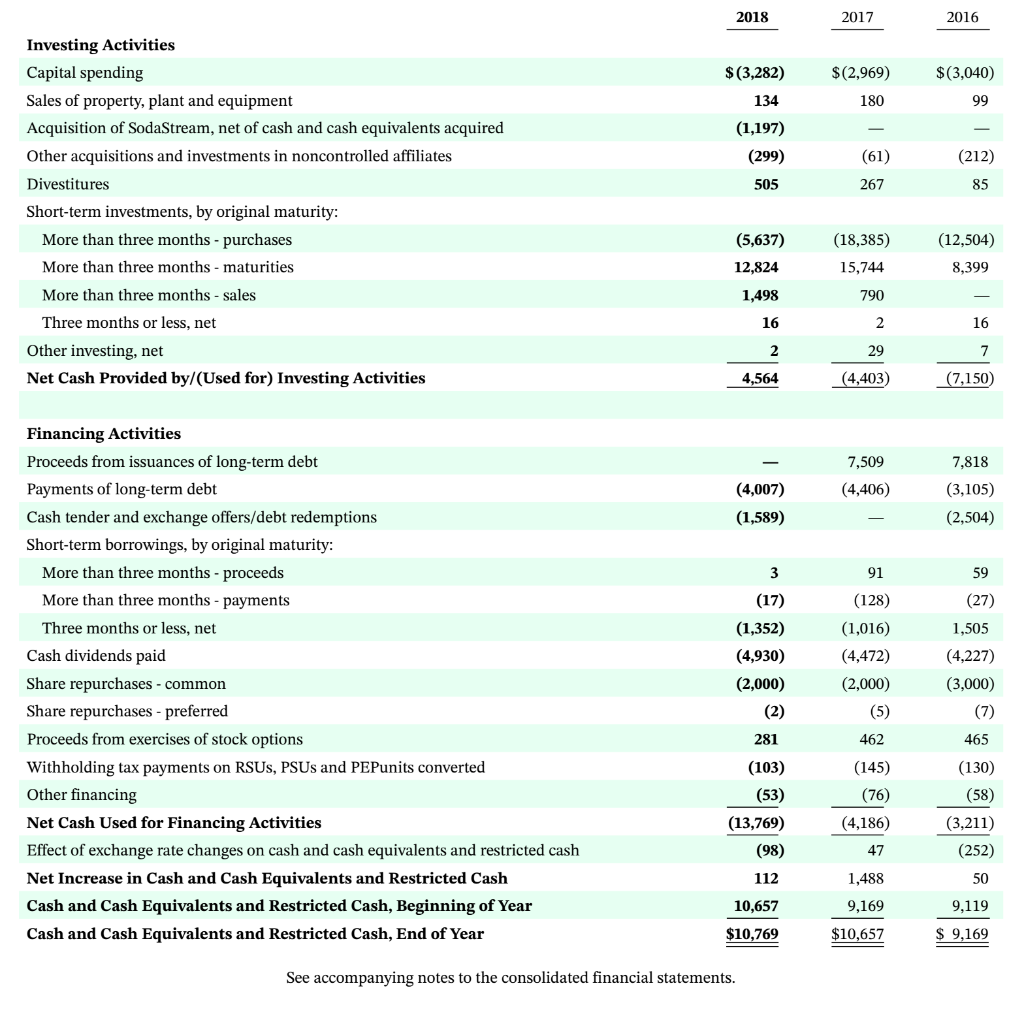
Consolidated Statement of Income PepsiCo, Inc. and Subsidiaries Fiscal years ended December 29, 2018, December 30, 2017 and December 31, 2016 (in millions except per share amounts) 2018 2017 2016 Net Revenue $64,661 $63,525 $62,799 28,222 29,381 28,796 35,280 34,729 34,577 Cost of sales Gross profit Selling, general and administrative expenses Operating Profit Other pension and retiree medical benefits income/expense) 25,170 24,453 24,773 10,110 10,276 9,804 298 233 (19) (1,342) Interest expense (1,525) (1,151) Interest income and other 306 244 110 Income before income taxes 9,602 8,553 9,189 (3,370) 12,559 4,694 2,174 4,908 6,379 44 51 50 (Benefit from)/provision for income taxes (See Note 5) Net income Less: Net income attributable to noncontrolling interests Net Income Attributable to PepsiCo Net Income Attributable to PepsiCo per Common Share Basic $12,515 $ 4,857 $ 6,329 $ 8.84 $ 3.40 $ 4.39 Diluted $ 8.78 $ 3.38 $ 4.36 Weighted-average common shares outstanding Basic 1,415 1,425 1,439 Diluted 1,425 1,438 1,452 See accompanying notes to the consolidated financial statements. 2017 2016 $4,908 $6,379 Consolidated Statement of Comprehensive Income PepsiCo, Inc. and Subsidiaries Fiscal years ended December 29, 2018, December 30, 2017 and December 31, 2016 (in millions) 2018 Net income $12,559 Other comprehensive income/(loss), net of taxes: Net currency translation adjustment (1,641) Net change on cash flow hedges 40 Net pension and retiree medical adjustments (467) Net change on available-for-sale securities (302) 1,109 (36) 46 (159) (68) (316) (24) 6 Other 16 862 5,770 (596) 5,783 Comprehensive income Comprehensive income attributable to noncontrolling interests Comprehensive Income Attributable to PepsiCo (2,062) 10,497 (44) ( $10.45 (51) $5,719 (54) $5,729 See accompanying notes to the consolidated financial statements. 2016 $ 6,379 2,368 284 160 (125) 373 501 Consolidated Statement of Cash Flows PepsiCo, Inc. and Subsidiaries Fiscal years ended December 29, 2018, December 30, 2017 and December 31, 2016 (in millions) 2018 2017 Operating Activities Net income $12,559 $ 4,908 Depreciation and amortization 2,399 2,369 Share-based compensation expense 256 292 Restructuring and impairment charges 308 295 Cash payments for restructuring charges (255) (113) Charge related to the transaction with Tingyi Pension and retiree medical plan expenses 221 221 Pension and retiree medical plan contributions (1,708) (220) Deferred income taxes and other tax charges and credits (531) 619 Other net tax benefits related to international reorganizations (4,347) Net tax (benefit)/expense related to the TCJ Act ( (28) 2,451 Change in assets and liabilities: Accounts and notes receivable (253) (202) Inventories (174) Prepaid expenses and other current assets 20 Accounts payable and other current liabilities 882 201 Income taxes payable 333 (338) Other, net (256) (305) Net Cash Provided by Operating Activities 9,415 10,030 (695) 452 (349) (75) (168) 1] 981 329 70 10,663 (continues) 2018 2017 2016 $ (3,282) $(3,040) $(2,969) 180 134 99 (1,197) (299) (61) (212) 505 505 267 85 Investing Activities Capital spending Sales of property, plant and equipment Acquisition of SodaStream, net of cash and cash equivalents acquired Other acquisitions and investments in noncontrolled affiliates Divestitures Short-term investments, by original maturity: More than three months - purchases More than three months - maturities More than three months - sales Three months or less, net Other investing, net Net Cash Provided by/(Used for) Investing Activities (5,637) 12,824 (18,385) 15,744 (12,504) 8,399 1,498 790 16 2 16 2 29 7 4,564 (4,403) (7,150) 7,509 (4,406) (4,007) (1,589) 7,818 (3,105) (2,504) 3 91 59 (27) Financing Activities Proceeds from issuances of long-ter debt Payments of long-term debt Cash tender and exchange offers/debt redemptions Short-term borrowings, by original maturity: More than three months - proceeds More than three months - payments Three months or less, net Cash dividends paid Share repurchases - common Share repurchases - preferred Proceeds from exercises of stock options Withholding tax payments on RSUS, PSUs and PEPunits converted Other financing Net Cash Used for Financing Activities Effect of exchange rate changes on cash and cash equivalents and restricted cash Net Increase in Cash and Cash Equivalents and Restricted Cash Cash and Cash Equivalents and Restricted Cash, Beginning of Year Cash and Cash Equivalents and Restricted Cash, End of Year (17) (1,352) (4,930) (2,000) (2) (128) (1,016) (4,472) (2,000) (5) 1,505 (4,227) (3,000) (7) 281 462 465 (103) (53) (145) (76) (4,186) (130) (58) (13,769) (98) (3,211) (252) 47 112 1,488 50 10,657 9,169 9,119 $10,769 $10,657 $ 9,169 See accompanying notes to the consolidated financial statements. Consolidated Balance Sheet PepsiCo, Inc. and Subsidiaries December 29, 2018 and December 30, 2017 (in millions except per share amounts) 2018 2017 $ 8,721 $10,610 272 8,900 1,997 7,142 7,024 3,128 2,947 1,546 ASSETS Current Assets Cash and cash equivalents Short-term investments Restricted cash Accounts and notes receivable, net Inventories Prepaid expenses and other current assets Total Current Assets Property, Plant and Equipment, net Amortizable Intangible Assets, net Goodwill Other indefinite-lived intangible assets Indefinite-Lived Intangible Assets Investments in Noncontrolled Affiliates Deferred Income Taxes Other Assets Total Assets 633 21,893 17,589 31,027 17,240 1,644 1,268 14,808 14,744 14,181 12,570 28,989 27,314 2,409 2,042 4,364 760 913 $77,648 $79,804 $ 4,026 $ 5,485 15,017 18,112 22,138 28,295 20,502 33,796 3,242 3.499 9,114 11,283 63,046 68,823 41 LIABILITIES AND EQUITY Current Liabilities Short-term debt obligations Accounts payable and other current liabilities Total Current Liabilities Long-Term Debt Obligations Deferred Income Taxes Other Liabilities Total Liabilities Commitments and contingencies Preferred Stock, no par value Repurchased Preferred Stock PepsiCo Common Shareholders' Equity Common stock, par value 1434 per share (authorized 3,600 shares, issued, net of repurchased common stock at par value: 1,409 and 1,420 shares, respectively) Capital in excess of par value Retained earnings Accumulated other comprehensive loss Repurchased common stock, in excess of par value (458 and 446 shares, respectively) Total PepsiCo Common Shareholders' Equity Noncontrolling interests Total Equity Total Liabilities and Equity (197) 23 24 3,996 3,953 59,947 (15,119) (34,286) 14,518 52,839 (13,057) (32,757) 11,045 84 92 14,602 10,981 $79,804 $77,648 Consolidated Statement of Equity PepsiCo, Inc. and Subsidiaries Fiscal years ended December 29, 2018, December 30, 2017 and December 31, 2016 (in millions) 2018 2017 2016 Shares Amount Shares Amount Shares Amount 0.8 $ 41 0.8 $ 41 0.8 $ 41 (0.1) (6) (0.7) (35) 0.8 41 0.8 41 (0.7) (197) (0.7) (192) (0.7) (186) (2) (5) (6) 0.7 199 (0.7) (197) (0.7) (192) 1,420 24 1,428 24 1,448 24 1 (1) (8) (12) 1,409 (20) 1,428 23 1,420 24 24 3,996 4,076 Preferred Stock Balance, beginning of year Conversion to common stock Retirement of preferred stock Balance, end of year Repurchased Preferred Stock Balance, beginning of year Redemptions Retirement of preferred stock Balance, end of year Common Stock Balance, beginning of year Share issued in connection with preferred stock conversion to common stock Change in repurchased common stock Balance, end of year Capital in Excess of Par Value Balance, beginning of year Share-based compensation expense Equity issued in connection with preferred stock conversion to common stock Stock option exercises, RSUS, PSUs and PEPunits converteda) Withholding tax on RSUS, PSUs and PEPunits converted Other Balance, end of year Retained Earnings Balance, beginning of year Cumulative effect of accounting changes Net income attributable to PepsiCo Cash dividends declared - common) Cash dividends declared - preferred Retirement of preferred stock Balance, end of year Accumulated Other Comprehensive Loss Balance, beginning of year Other comprehensive (loss)/income attributable to PepsiCo Balance, end of year 4,091 290 250 289 6 (193) (138) (103) (236) (145) (4) (130) (3) (6) 3,953 3,996 4,091 52,839 52,518 50,472 (145) 12,515 6,329 4,857 (4,536) (5,098) (4,282) (1) (164) 59,947 52,839 52,518 (13,919) (13,057) (2,062) (13,319) (600) 862 (15,119) (13,057) (13,919) (continues) 2018 2017 2016 Shares Amount Shares Amount Shares Amount (446) (18) $(32,757) (2,000) (438) (18) $(31,468) (2,000) (418) (29) $(29,185) (3,000) 6 469 10 708 9 712 2 3 5 (458) (34,286) (446) (32,757) (438) (31,468) 14,518 11,045 11,246 Repurchased Common Stock Balance, beginning of year Share repurchases Stock option exercises, RSUS, PSUs and PEPunits converted Other Balance, end of year Total PepsiCo Common Shareholders' Equity Noncontrolling Interests Balance, beginning of year Net income attributable to noncontrolling interests Distributions to noncontrolling interests Currency translation adjustment: Other, net Balance, end of year Total Equity 92 104 107 44 51 50 (49) (62) (55) 4 (3) (1) (2) 84 92 104 $ 14,602 $ 10,981 $ 11,199 The Coca-Cola Company is a global leader in the beverage industry. It offers hundreds of brands, including soft drinks, fruit juices, sports drinks, and other beverages, in more than 200 countries. The following are Coca-Cola's financial statements as presented in its 2018 annual report. The complete annual report, including notes to the financial statements, is available at the company's website. The Coca-Cola Company and Subsidiaries Consolidated Statements of Income Year Ended December 31, 2018 2017 2016 (in millions except per share data) $35,410 13,255 $41,863 16,465 $31,856 11,770 20,086 10,307 1,079 22,155 12,654 1,902 25,398 15,370 1,371 8,700 682 919 1,008 (1,121) 7,599 677 841 1,071 (1,764) 6,742 5,560 8,657 642 733 835 (1,265) 8,136 1,586 8,350 1,623 NET OPERATING REVENUES Cost of goods sold GROSS PROFIT Selling, general and administrative expenses Other operating charges OPERATING INCOME Interest income Interest expense Equity income (loss)-net Other income (loss)-net INCOME FROM CONTINUING OPERATIONS BEFORE INCOME TAXES Income taxes from continuing operations NET INCOME FROM CONTINUING OPERATIONS Income (loss) from discontinued operations (net of income taxes of $126, $47 and $0, respectively) CONSOLIDATED NET INCOME Less: Net income attributable to noncontrolling interests NET INCOME ATTRIBUTABLE TO SHAREOWNERS OF THE COCA-COLA COMPANY Basic net income per share from continuing operations Basic net income (loss) per share from discontinued operations BASIC NET INCOME PER SHARE Diluted net income per share from continuing operations! Diluted net income (loss) per share from discontinued operations DILUTED NET INCOME PER SHARE 6,550 6,727 (251) 1,182 101 6,476 42 1,283 35 6,550 23 $ 6,434 $ 1,248 $ 6,527 $ 1.51 $ 1.58 (0.07) $ 0.28 0.02 $ 1.51 $ 0.293 $ 1.51 $ 1.57 $ 1.49 $ 0.27 0.02 (0.07) $ 1.50 $ 0.29 $ 1.49 AVERAGE SHARES OUTSTANDING-BASIC Effect of dilutive securities 4,259 40 4,272 52 4,317 50 AVERAGE SHARES OUTSTANDING-DILUTED 4,299 4,324 4,367 Calculated based on net income from continuing operations less net income from continuing operations attributable to noncontrolling interests. 2Calculated based on net income (loss) from discontinued operations less net income from discontinued operations attributable to noncontrolling interests. 3Per share amounts do not add due to rounding. Refer to Notes to Consolidated Financial Statements. The Coca-Cola Company and Subsidiaries Consolidated Statements of Comprehensive Income Year Ended December 31, 2018 2017 2016 (in millions) $6,476 $1,283 $6,550 CONSOLIDATED NET INCOME Other comprehensive income: Net foreign currency translation adjustments Net gains (losses) on derivatives Net unrealized gains (losses) on available-for-sale securities Net change in pension and other benefit liabilities (2,035) (7) (34) 29 861 (433) 188 (626) (382) 17 (53) 322 4,429 95 2,221 73 5,506 10 TOTAL COMPREHENSIVE INCOME Less: Comprehensive income attributable to noncontrolling interests TOTAL COMPREHENSIVE INCOME ATTRIBUTABLE TO SHAREOWNERS OF THE COCA-COLA COMPANY $4,334 $2,148 $5,496 Refer to Notes to Consolidated Financial Statements. The Coca-Cola Company and Subsidiaries Consolidated Balance Sheets 2018 2017 $ 8,926 2,025 $ 6,006 9,352 10,951 15,358 5,013 3,396 2,766 1,962 5,317 3,667 2,655 2,000 219 7,329 6,546 30,634 36,545 19,407 867 4,139 2,667 8,232 6,682 51 10,263 274 20,856 1,096 4,230 330 8,203 6,729 138 9,401 368 December 31, (in millions except par value) ASSETS CURRENT ASSETS Cash and cash equivalents Short-term investments TOTAL CASH, CASH EQUIVALENTS AND SHORT-TERM INVESTMENTS Marketable securities Trade accounts receivable, less allowances of $489 and $477, respectively Inventories Prepaid expenses and other assets Assets held for sale Assets held for sale-discontinued operations TOTAL CURRENT ASSETS EQUITY METHOD INVESTMENTS OTHER INVESTMENTS OTHER ASSETS DEFERRED INCOME TAX ASSETS PROPERTY, PLANT AND EQUIPMENT-net TRADEMARKS WITH INDEFINITE LIVES BOTTLERS' FRANCHISE RIGHTS WITH INDEFINITE LIVES GOODWILL OTHER INTANGIBLE ASSETS TOTAL ASSETS LIABILITIES AND EQUITY CURRENT LIABILITIES Accounts payable and accrued expenses Loans and notes payable Current maturities of long-term debt Accrued income taxes Liabilities held for sale Liabilities held for sale--discontinued operations TOTAL CURRENT LIABILITIES LONG-TERM DEBT OTHER LIABILITIES DEFERRED INCOME TAX LIABILITIES THE COCA-COLA COMPANY SHAREOWNERS' EQUITY Common stock, $0.25 par value; Authorized11,200 shares; Issued7,040 and 7,040 shares, respectively Capital surplus Reinvested earnings Accumulated other comprehensive income (loss) Treasury stock, at cost-2,772 and 2,781 shares, respectively EQUITY ATTRIBUTABLE TO SHAREOWNERS OF THE COCA-COLA COMPANY EQUITY ATTRIBUTABLE TO NONCONTROLLING INTERESTS TOTAL EQUITY TOTAL LIABILITIES AND EQUITY $83,216 $87,896 $ 8,748 13,205 $ 8,932 13,194 4,997 378 3,298 1,722 410 37 1,496 27,194 29,223 25,364 7,638 1,933 31,182 8,021 2,522 1,760 1,760 16,520 63,234 (12,814) (51,719) 16,981 2,077 15,864 60,430 (10,305) (50,677) 17,072 1,905 19,058 18,977 $83,216 $87,896 The Coca-Cola Company and Subsidiaries Consolidated Statements of Cash Flows Year Ended December 31, 2018 2017 2016 $ 6.550 $ 6,476 251 6,727 1,086 225 (450) (457) (38) 189 558 682 (1,202) $ 1,283 (101) 1,182 1,260 219 (1,256) (628) 281 1,459 1,218 (269) 3,464 6,550 1,787 258 (856) (449) 158 1,146 647 (224) (225) 7,320 6,930 8,792 (7,789) 14,977 (1,040) 1,362 (1,347) 245 (60) (17,296) 16,694 (3,809) 3,821 (1,675) 104 (93) (2,254) (16,626) 17,842 (838) 1,035 (2,262) 150 (305) (In millions) OPERATING ACTIVITIES Consolidated net income (Income) loss from discontinued operations Net income from continuing operations Depreciation and amortization Stock-based compensation expense Deferred income taxes Equity income) loss-net of dividends Foreign currency adjustments Significant (gains) losses on sales of assets-net Other operating charges Other items Net change in operating assets and liabilities Net cash provided by operating activities INVESTING ACTIVITIES Purchases of investments Proceeds from disposals of investments Acquisitions of businesses, equity method investments and nonmarketable securities Proceeds from disposals of businesses, equity method investments and nonmarketable securities Purchases of property, plant and equipment Proceeds from disposals of property, plant and equipment Other investing activities Net cash provided by (used in) investing activities FINANCING ACTIVITIES Issuances of debt Payments of debt Issuances of stock Purchases of stock for treasury Dividends Other financing activities Net cash provided by (used in) financing activities CASH FLOWS FROM DISCONTINUED OPERATIONS Net cash provided by (used in) operating activities from discontinued operations Net cash provided by (used in) investing activities from discontinued operations Net cash provided by (used in) financing activities from discontinued operations Net cash provided by (used in) discontinued operations EFFECT OF EXCHANGE RATE CHANGES ON CASH, CASH EQUIVALENTS, RESTRICTED CASH AND RESTRICTED CASH EQUIVALENTS CASH, CASH EQUIVALENTS, RESTRICTED CASH AND RESTRICTED CASH EQUIVALENTS Net increase (decrease) in cash, cash equivalents, restricted cash and restricted cash equivalents during the year Cash, cash equivalents, restricted cash and restricted cash equivalents at beginning of year Cash, cash equivalents, restricted cash and restricted cash equivalents at end of year Less: Restricted cash and restricted cash equivalents at end of year Cash and cash equivalents at end of year 6,348 (1,004) 29,857 (28,768) 27,281 (25,615) 1,595 1,434 27,339 (30,568) 1,476 (1,912) (6,644) (243) (10,552) (3,682) (6,320) (91) (7,409) (3,681) (6,043) 79 (6,545) 307 (421) 205 111 (58) (38) 91 15 (262) 241 (5) 2,945 6,373 (2,477) 8,850 1,238 7,612 9,318 392 6,373 367 8,850 295 $ 8,926 $ 6,006 $ 8,555 Refer to Notes to Consolidated Financial Statements. The Coca-Cola Company and Subsidiaries Consolidated Statements of Shareowners' Equity 2018 2017 2016 Year Ended December 31, (in millions except per share data) EQUITY ATTRIBUTABLE TO SHAREOWNERS OF THE COCA-COLA COMPANY NUMBER OF COMMON SHARES OUTSTANDING Balance at beginning of year Treasury stock issued to employees related to stock compensation plans Purchases of stock for treasury Balance at end of year 4,259 48 (39) 4,288 53 (82) 4,324 50 (86) 4,268 4,259 4,288 COMMON STOCK $ 1,760 $ 1,760 $ 1,760 15,864 14,993 655 467 14,016 589 130 258 225 (36) 219 (3) 16,520 15,864 14,993 65,502 65,018 60,430 3,014 6,434 (6,644) 1.248 (6,320) 6,527 (6,043) 65,502 63,234 60,430 (11,205) (10,174) (10,305) (409) (2,100) (12,814) 900 CAPITAL SURPLUS Balance at beginning of year Stock issued to employees related to stock compensation plans Tax benefit (charge) from stock compensation plans Stock-based compensation expense Other activities Balance at end of year REINVESTED EARNINGS Balance at beginning of year Adoption of accounting standards Net income attributable to shareowners of The Coca-Cola Company Dividends (per share$1.56, $1.48 and $1.40 in 2018, 2017 and 2016, respectively) Balance at end of year ACCUMULATED OTHER COMPREHENSIVE INCOME (LOSS) Balance at beginning of year Adoption of accounting standards Net other comprehensive income (loss) Balance at end of year TREASURY STOCK Balance at beginning of year Treasury stock issued to employees related to stock compensation plans Purchases of stock for treasury Balance at end of year TOTAL EQUITY ATTRIBUTABLE TO SHAREOWNERS OF THE COCA-COLA COMPANY EQUITY ATTRIBUTABLE TO NONCONTROLLING INTERESTS Balance at beginning of year Net income attributable to noncontrolling interests Net foreign currency translation adjustments Dividends paid to noncontrolling interests Contributions by noncontrolling interests Business combinations Deconsolidation of certain entities Other activities TOTAL EQUITY ATTRIBUTABLE TO NONCONTROLLING INTERESTS (1,031) (10,305) (11,205) (50,677) 704 (1,746) (47,988) 909 (3,598) (45,066) 811 (3,733) (51,719) (50,677) (47,988) $16,981 $17,072 $23,062 $ $ 1,905 42 53 (31) 158 35 38 (15) $ 210 23 (13) (25) 1 101 1,805 (157) 41 (34) (4) 7 $ 2,077 $ 1,905 $ 158 Refer to Note 1, Note 3, Note 4 and Note 15. Notod