Answered step by step
Verified Expert Solution
Question
1 Approved Answer
Current ratio Quick ratio Debt to equity ratio Times interest earned ratio Receivables turnover ratio Average collection period Inventory turnover ratio Average days inventory held
| Current ratio |
| Quick ratio |
| Debt to equity ratio |
| Times interest earned ratio |
| Receivables turnover ratio |
| Average collection period |
| Inventory turnover ratio |
| Average days inventory held |
| Payables turnover ratio |
| Average days payables outstanding |
| Asset turnover ratio |
| Profit margin on sales |
| Return on assets (ROA) |
| Return on shareholders' equity (ROE) |
To calculate the above statement using the following material:


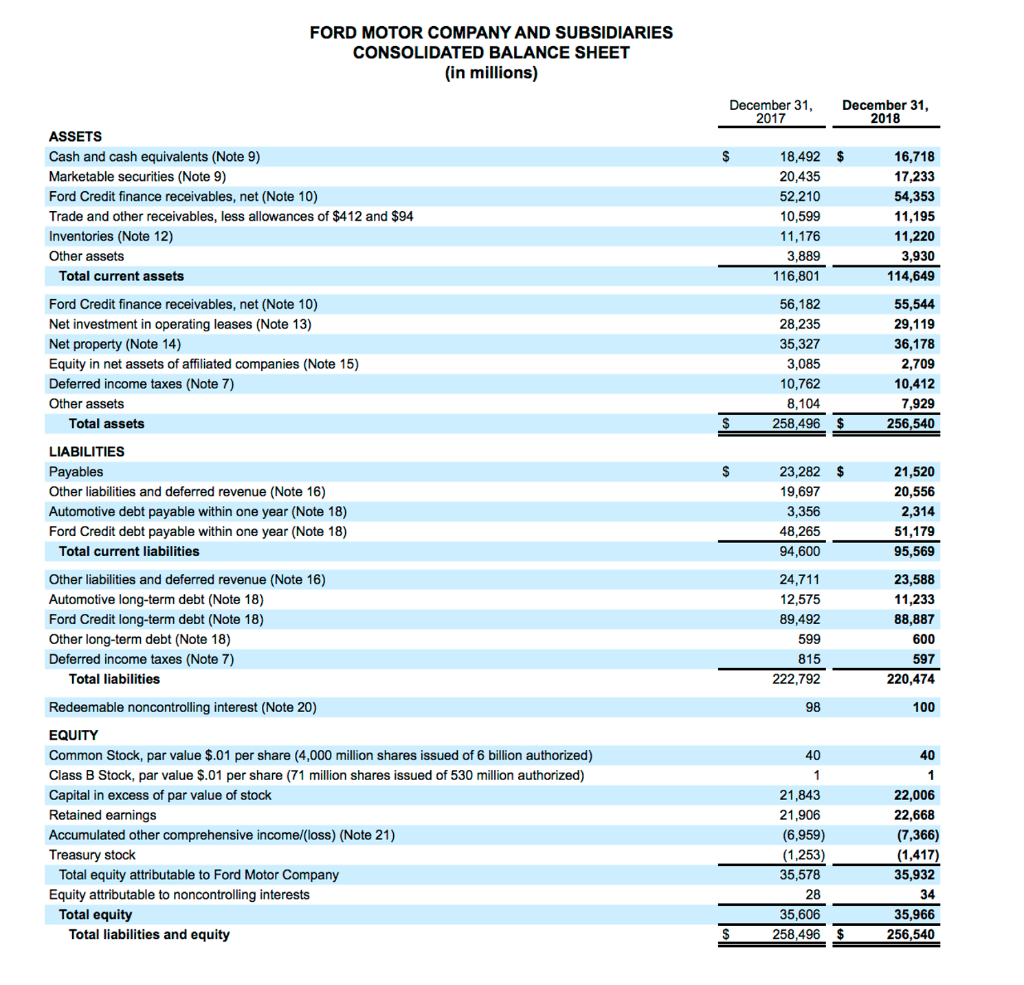
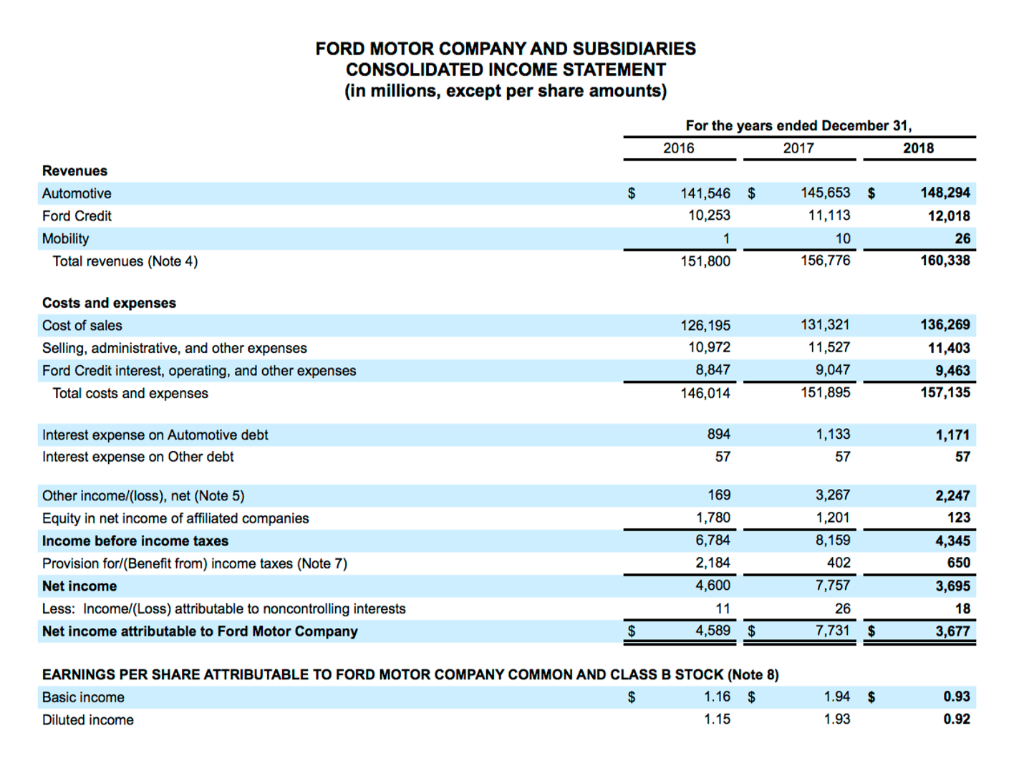
FORD MOTOR COMPANY AND SUBSIDIARIES CONSOLIDATED BALANCE SHEET (in millions) December 31 2018 December 31 2017 ASSETS Cash and cash equivalents (Note 9) 16,718 Marketable securities (Note 9) 20,435 17,233 Ford Credit finance receivables, net (Note 10) Trade and other receivables, less allowances of $412 and $94 52,210 54,353 11,195 10,599 Inventories (Note 12) 3,889 Other assets 3,930 116,801 114,649 Total current assets Ford Credit finance receivables, net (Note 10) 55,544 Net investment in operating leases (Note 13) 28,235 29,119 Net property (Note 14) 35,327 36,178 2,709 Equity in net assets of affiliated companies (Note 15) 3,085 10,762 10,412 Deferred income taxes (Note 7) Other assets 7,929 Total assets 258,496 $ 256,540 LIABILITIES Payables 23,282 $ Other liabilities and deferred revenue (Note 16) 19,697 20,556 2,314 51,179 Automotive debt payable within one year (Note 18) 3,356 Ford Credit debt payable within one year (Note 18) 48,265 Total current liabilities 94,600 95,569 Other liabilities and deferred revenue (Note 16) 24,711 23,588 Automotive long-term debt (Note 18) 12,575 11,233 89,492 Ford Credit long-term debt (Note 18) 88,887 600 Other long-term debt (Note 18) 599 Deferred income taxes (Note 7) 597 Total liabilities 222,792 220,474 Redeemable noncontrolling interest (Note 20) EQUITY Common Stock, par value $.01 per share (4,000 million shares issued of 6 billion authorized) Class B Stock, par value $.01 per share (71 million shares issued of 530 million authorized) Capital in excess of par value of stock 21,843 22,006 21,906 22,668 Retained earnings Accumulated other comprehensive income/(loss) (Note 21) (7,366) Treasury stock Total equity attributable to Ford Motor Company 35,578 35,932 Equity attributable to noncontrolling interests Total equity 35,966 35,606 258,496$ Total liabilities and equity 256,540 FORD MOTOR COMPANY AND SUBSIDIARIES CONSOLIDATED INCOME STATEMENT (in millions, except per share amounts) For the years ended December 31, 2016 2017 2018 Revenues 148,294 141,546 $ 145,653 $ Automotive 11,113 12,018 10,253 Ford Credit Mobility 10 26 151,800 156,776 160,338 Total revenues (Note 4) Costs and expenses 131,321 136,269 Cost of sales 126,195 10,972 Selling, administrative, and other expenses 11,527 11,403 8,847 9,047 9,463 Ford Credit interest, operating, and other expenses 146,014 151,895 157,135 Total costs and expenses 894 1,133 Interest expense on Automotive debt 1,171 Interest expense on Other debt 57 57 57 169 3,267 Other incomel/(loss), net (Note 5) 2,247 1,780 123 1,201 Equity in net income of affiliated companies 8,159 Income before income taxes 6,784 4,345 402 2,184 Provision for/(Benefit from) income taxes (Note 7) 650 4,600 7,757 Net income 3,695 Less: Incomel(Loss) attributable to noncontrolling interests 26 18 4,589 $ 7,731 $ 3,677 Net income attributable to Ford Motor Company EARNINGS PER SHARE ATTRIBUTABLE TO FORD MOTOR COMPANY COMMON AND CLASS B STOCK (Note 8) 1.16 $ 1.94 $ 0.93 Basic income 1.93 1.15 0.92 Diluted income
Step by Step Solution
There are 3 Steps involved in it
Step: 1

Get Instant Access to Expert-Tailored Solutions
See step-by-step solutions with expert insights and AI powered tools for academic success
Step: 2

Step: 3

Ace Your Homework with AI
Get the answers you need in no time with our AI-driven, step-by-step assistance
Get Started


