

Customer: Wind Operations Executives
Our Business: The Wind Operations team at NextEra Energy Resources is responsible for generating electricity (MWh) at its wind sites located in the U.S. Their primary objective is to run the fleet at minimum operating cost ($/MWh)
Case Study Request: Executive Management has requested the analyst to identify potential cost reduction opportunities in the fleet. Provide 3-5 actionable implementable ideas on how to reduce cost. You may break your analysis into following categories: -
- What trends do you see in the data? Is there anything you would make management aware of?
- Provide clear rationale behind the trends that youre highlighting in (1).
- Actionable recommendations to address these issues (technology, process etc.) and improve cost performance
Please provide appropriate references on the slides, in case you use an external source
Dataset provided: Attached dataset contains two tabs:
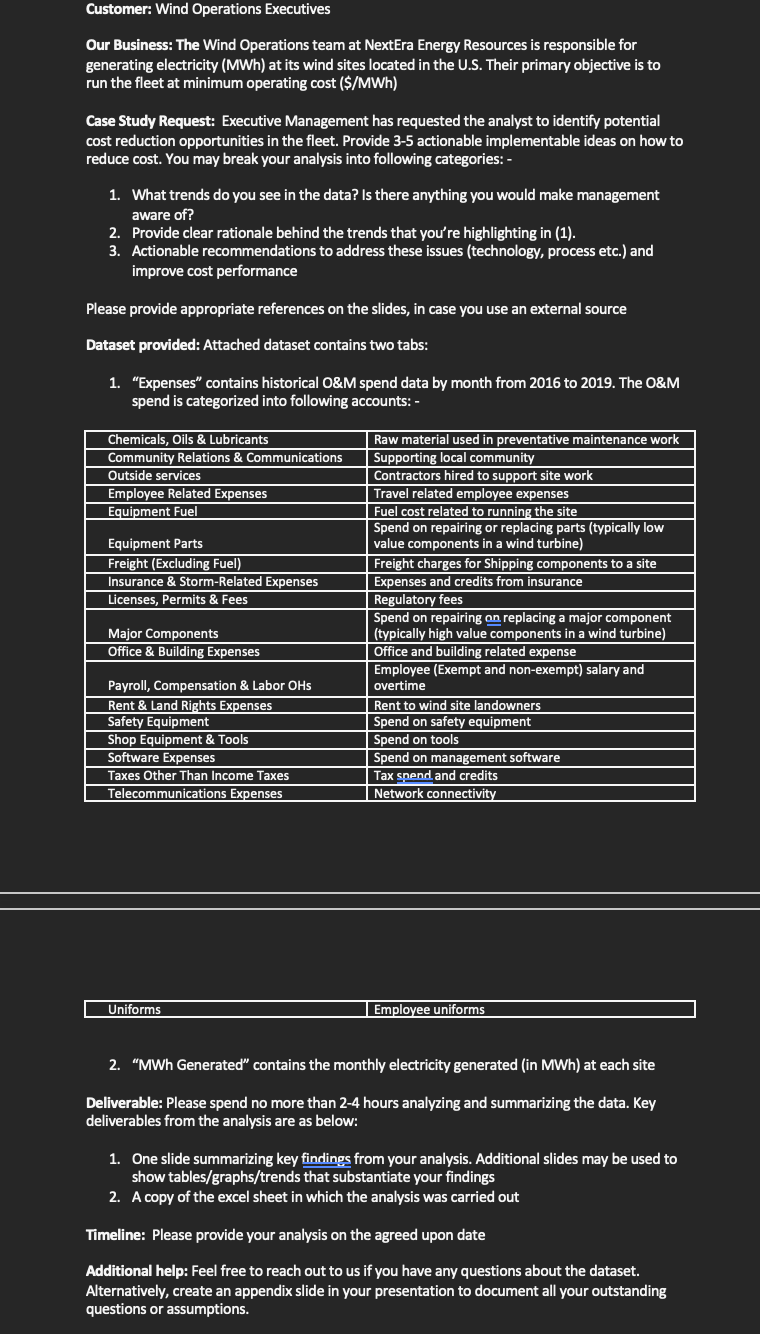
- Expenses contains historical O&M spend data by month from 2016 to 2019. The O&M spend is categorized into following accounts: -
- MWh Generated contains the monthly electricity generated (in MWh) at each site Deliverable: Please spend no more than 2-4 hours analyzing and summarizing the data. Key deliverables from the analysis are as below:
- One slide summarizing key findings from your analysis. Additional slides may be used to show tables/graphs/trends that substantiate your findings
- A copy of the excel sheet in which the analysis was carried out
-
Timeline: Please provide your analysis on the agreed upon date
Customer: Wind Operations Executives Our Business: The Wind Operations team at NextEra Energy Resources is responsible for generating electricity (MWh) at its wind sites located in the U.S. Their primary objective is to run the fleet at minimum operating cost (\$/MWh) Case Study Request: Executive Management has requested the analyst to identify potential cost reduction opportunities in the fleet. Provide 3-5 actionable implementable ideas on how to reduce cost. You may break your analysis into following categories: - 1. What trends do you see in the data? Is there anything you would make management aware of? 2. Provide clear rationale behind the trends that you're highlighting in (1). 3. Actionable recommendations to address these issues (technology, process etc.) and improve cost performance Please provide appropriate references on the slides, in case you use an external source Dataset provided: Attached dataset contains two tabs: 1. "Expenses" contains historical O\&M spend data by month from 2016 to 2019. The O\&M spend is categorized into following accounts: - 2. "MWh Generated" contains the monthly electricity generated (in MWh) at each site Deliverable: Please spend no more than 2-4 hours analyzing and summarizing the data. Key deliverables from the analysis are as below: 1. One slide summarizing key findings from your analysis. Additional slides may be used to show tables/graphs/trends that substantiate your findings 2. A copy of the excel sheet in which the analysis was carried out Timeline: Please provide your analysis on the agreed upon date Additional help: Feel free to reach out to us if you have any questions about the dataset. Alternatively, create an appendix slide in your presentation to document all your outstanding questions or assumptions. Customer: Wind Operations Executives Our Business: The Wind Operations team at NextEra Energy Resources is responsible for generating electricity (MWh) at its wind sites located in the U.S. Their primary objective is to run the fleet at minimum operating cost (\$/MWh) Case Study Request: Executive Management has requested the analyst to identify potential cost reduction opportunities in the fleet. Provide 3-5 actionable implementable ideas on how to reduce cost. You may break your analysis into following categories: - 1. What trends do you see in the data? Is there anything you would make management aware of? 2. Provide clear rationale behind the trends that you're highlighting in (1). 3. Actionable recommendations to address these issues (technology, process etc.) and improve cost performance Please provide appropriate references on the slides, in case you use an external source Dataset provided: Attached dataset contains two tabs: 1. "Expenses" contains historical O\&M spend data by month from 2016 to 2019. The O\&M spend is categorized into following accounts: - 2. "MWh Generated" contains the monthly electricity generated (in MWh) at each site Deliverable: Please spend no more than 2-4 hours analyzing and summarizing the data. Key deliverables from the analysis are as below: 1. One slide summarizing key findings from your analysis. Additional slides may be used to show tables/graphs/trends that substantiate your findings 2. A copy of the excel sheet in which the analysis was carried out Timeline: Please provide your analysis on the agreed upon date Additional help: Feel free to reach out to us if you have any questions about the dataset. Alternatively, create an appendix slide in your presentation to document all your outstanding questions or assumptions


