Answered step by step
Verified Expert Solution
Link Copied!

Question

1 Approved Answer

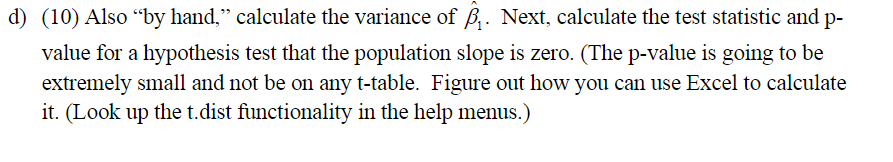
d) (10) Also by hand, calculate the variance of fj'l. Next, calculate the test statistic and p- value for a hypothesis test that the population

image text in transcribed
d) (10) Also \"by hand,\" calculate the variance of fj'l. Next, calculate the test statistic and p- value for a hypothesis test that the population slope is zero. (I he p-Value is going to be extremely small and not be on any t-table. Figure out how you can use Excel to calculate it. (Look 11p the t.dist functionality in the help menus.)

Step by Step Solution

There are 3 Steps involved in it

Step: 1

blur-text-image

Get Instant Access to Expert-Tailored Solutions

See step-by-step solutions with expert insights and AI powered tools for academic success

Step: 2

blur-text-image

Step: 3

blur-text-image

Ace Your Homework with AI

Get the answers you need in no time with our AI-driven, step-by-step assistance

Get Started

Recommended Textbook for

Functional Analysis And The Feynman Operator Calculus

Authors: Tepper L Gill, Woodford W Zachary, Zachary Woodford

1st Edition

331927595X, 9783319275956

More Books

Students also viewed these Mathematics questions

Question

2. Information that comes most readily to mind (availability).

Answered: 1 week ago

Question

3. An initial value (anchoring).

Answered: 1 week ago

Question

4. Similarity (representativeness).

Answered: 1 week ago