Question
D A is a graphical technique that is used to analyze the relationship between two variables. O Scatter diagram O Run Chart O Control

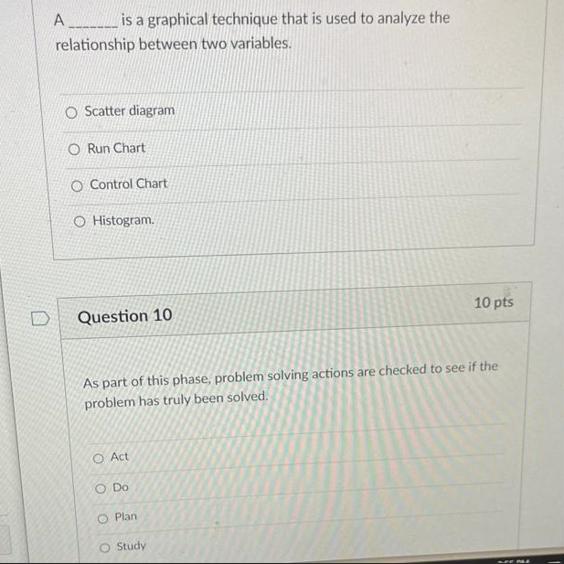
D A is a graphical technique that is used to analyze the relationship between two variables. O Scatter diagram O Run Chart O Control Chart O Histogram. Question 10 As part of this phase, problem solving actions are checked to see if the problem has truly been solved. O Act 10 pts O Do O Plan O Study
Step by Step Solution
3.45 Rating (152 Votes )
There are 3 Steps involved in it
Step: 1
The detailed answer for the above question is provided below a Scatter diagram is th...
Get Instant Access to Expert-Tailored Solutions
See step-by-step solutions with expert insights and AI powered tools for academic success
Step: 2

Step: 3

Ace Your Homework with AI
Get the answers you need in no time with our AI-driven, step-by-step assistance
Get StartedRecommended Textbook for
Applied Regression Analysis And Other Multivariable Methods
Authors: David G. Kleinbaum, Lawrence L. Kupper, Azhar Nizam, Eli S. Rosenberg
5th Edition
1285051084, 978-1285963754, 128596375X, 978-1285051086
Students also viewed these Finance questions
Question
Answered: 1 week ago
Question
Answered: 1 week ago
Question
Answered: 1 week ago
Question
Answered: 1 week ago
Question
Answered: 1 week ago
Question
Answered: 1 week ago
Question
Answered: 1 week ago
Question
Answered: 1 week ago
Question
Answered: 1 week ago
Question
Answered: 1 week ago
Question
Answered: 1 week ago
Question
Answered: 1 week ago
Question
Answered: 1 week ago
Question
Answered: 1 week ago
Question
Answered: 1 week ago
Question
Answered: 1 week ago
Question
Answered: 1 week ago
Question
Answered: 1 week ago
Question
Answered: 1 week ago
Question
Answered: 1 week ago
Question
Answered: 1 week ago
View Answer in SolutionInn App


