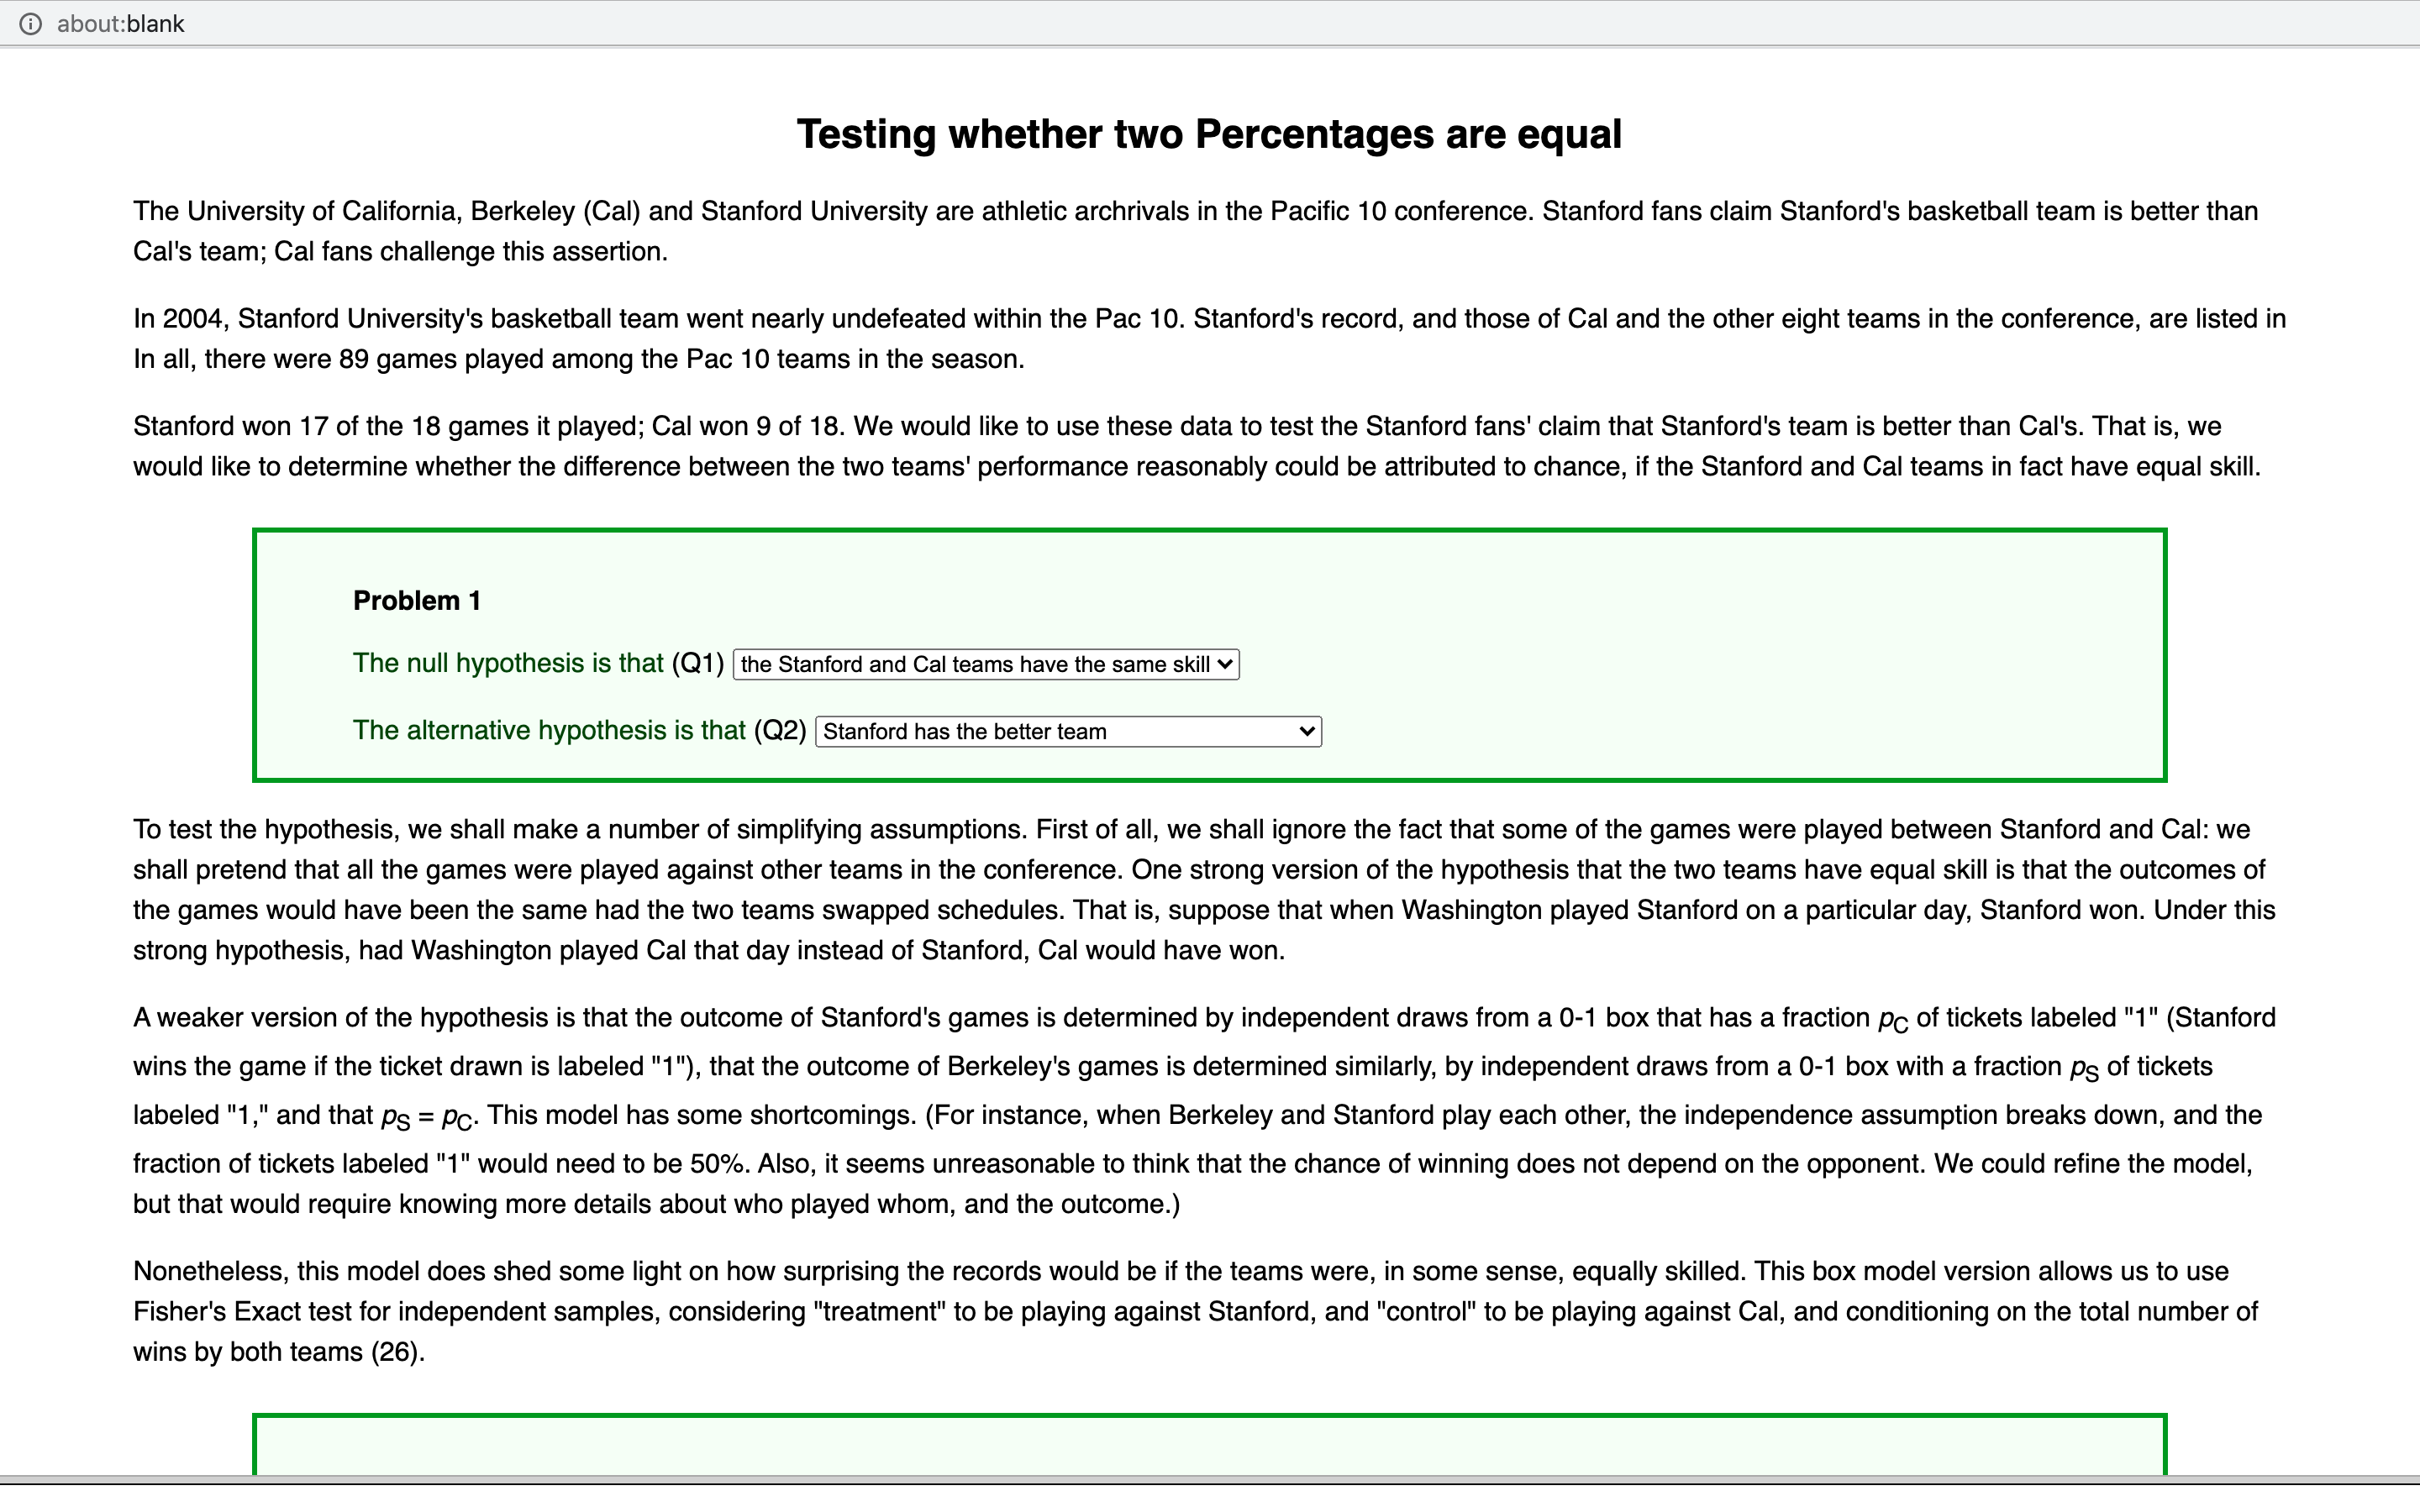
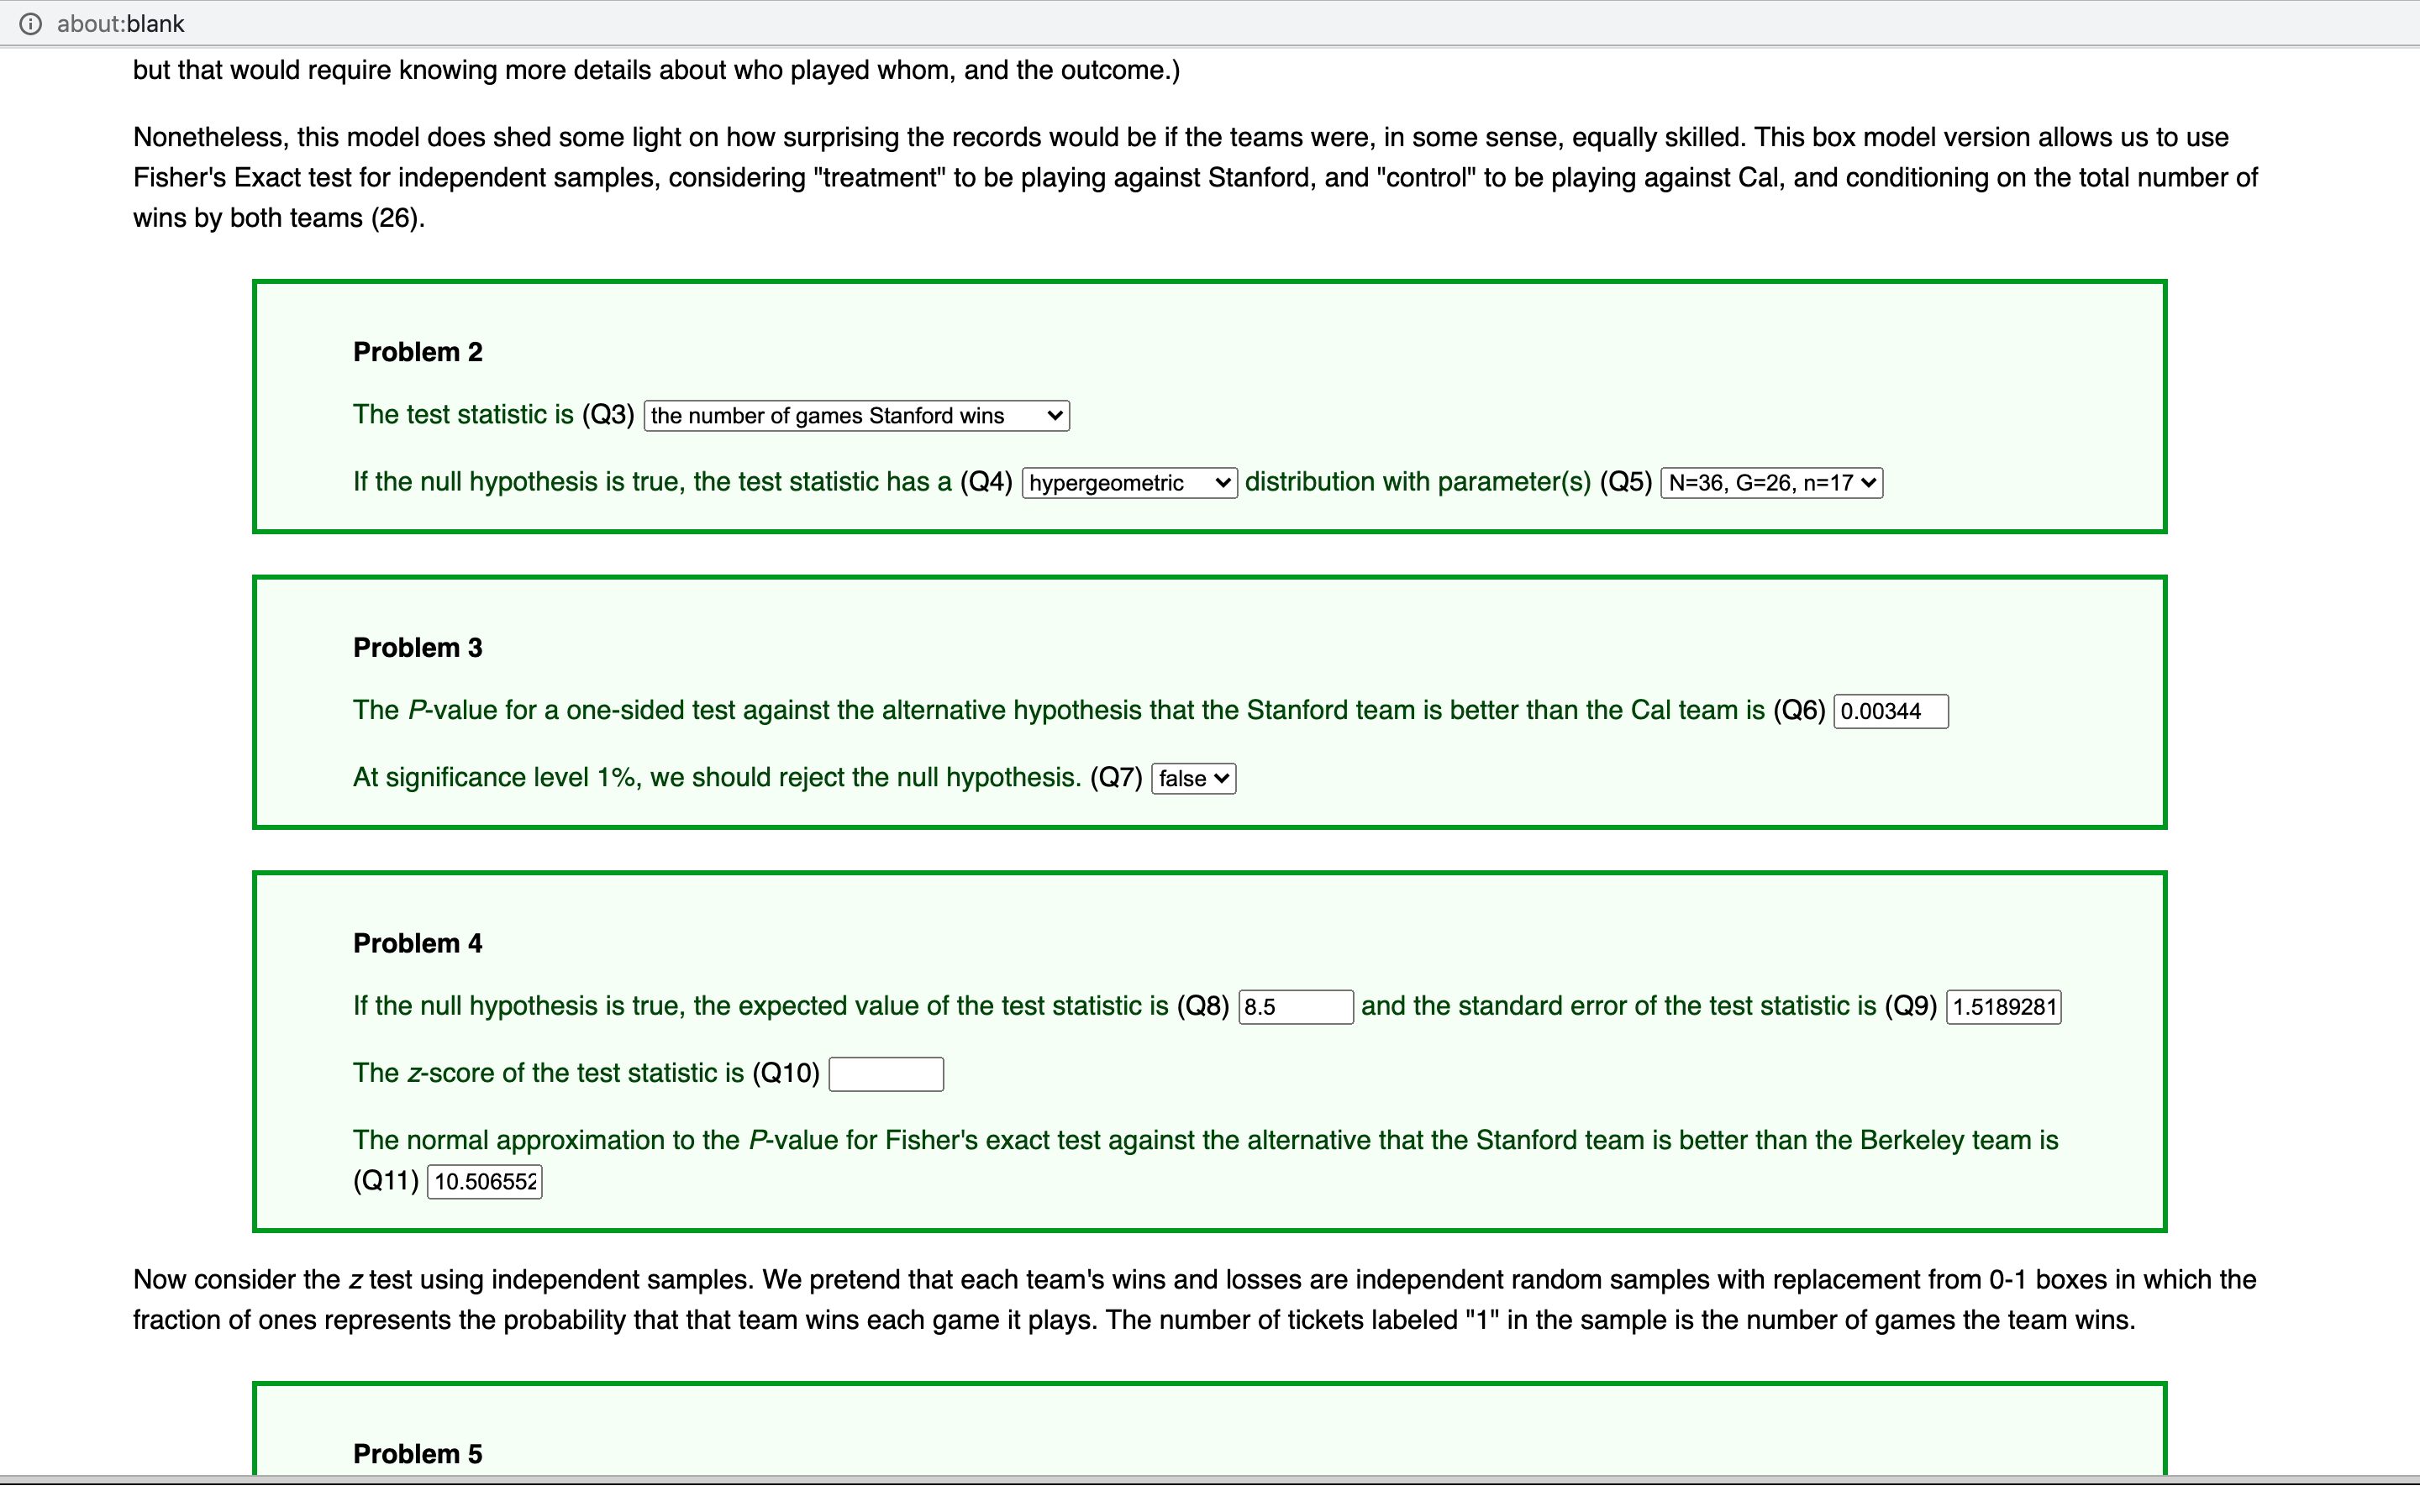
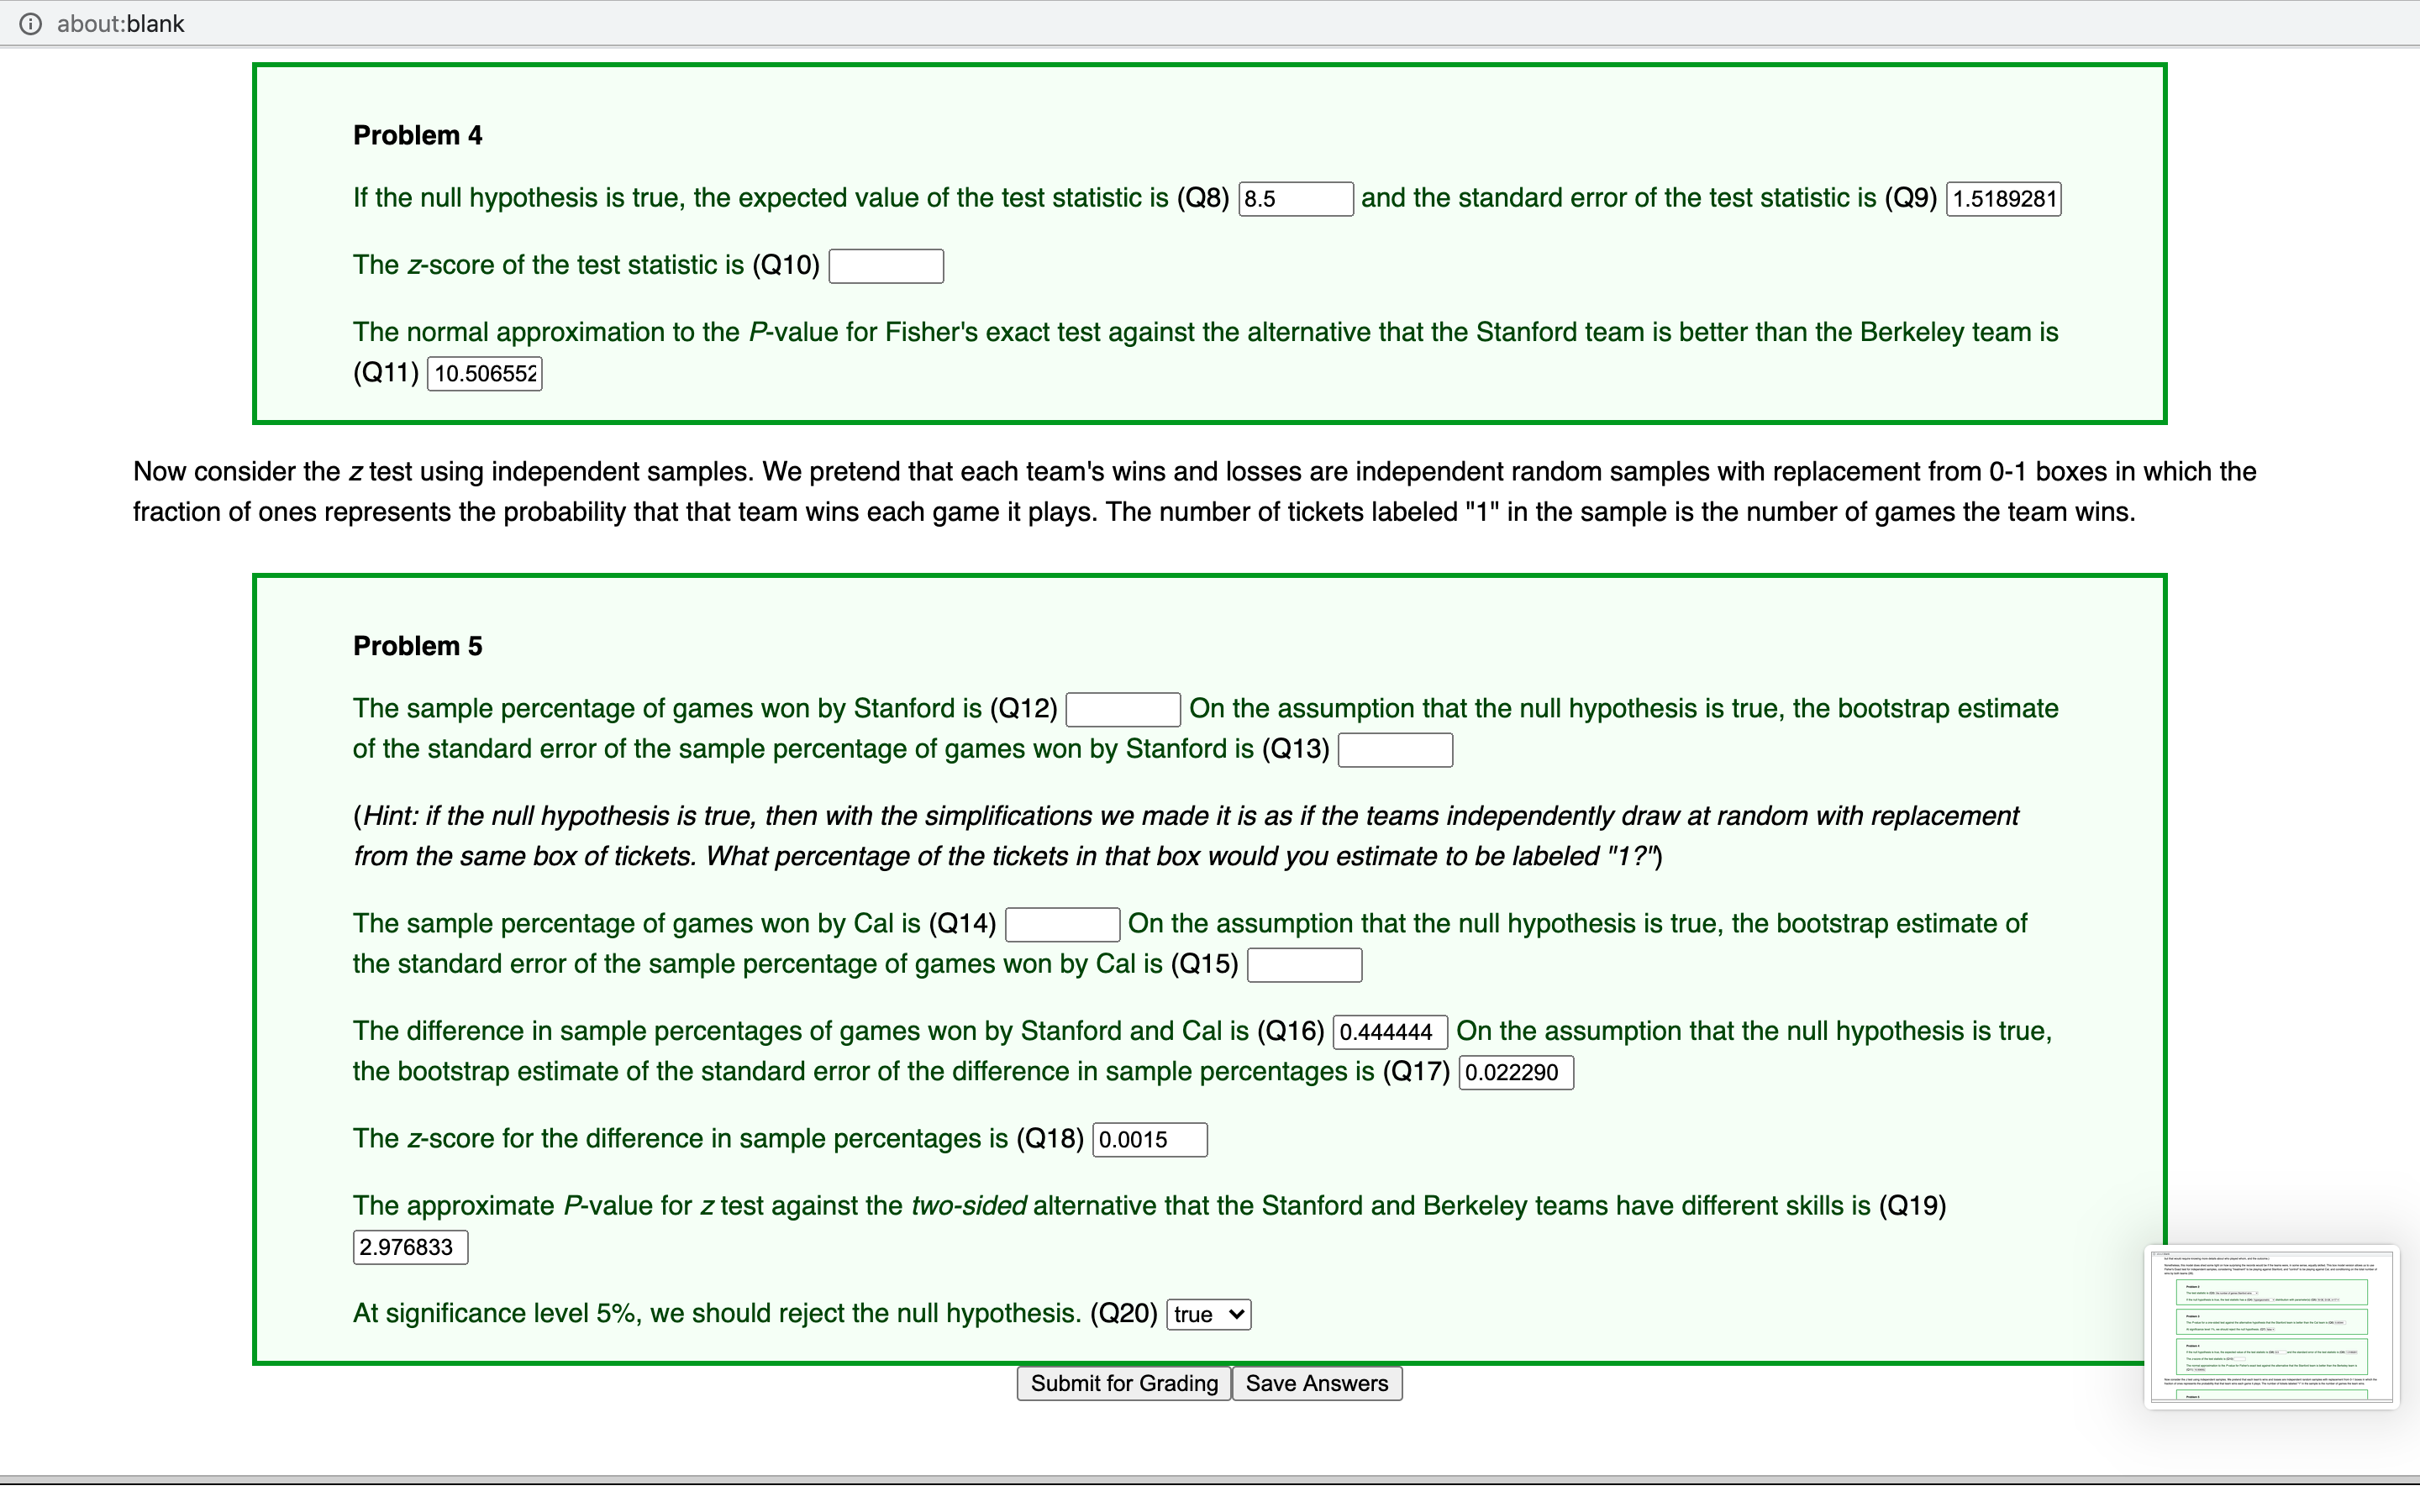
(D about:blank Testing whether two Percentages are equal The University of California, Berkeley (Cal) and Stanford University are athletic archrivals in the Pacific 10 conference. Stanford fans claim Stanford's basketball team is better than Cal's team; Cal fans challenge this assertion. In 2004, Stanford University's basketball team went nearly undefeated within the Pac 10. Stanford's record, and those of Cal and the other eight teams in the conference, are listed in In all, there were 89 games played among the Pac 10 teams in the season. Stanford won 17 of the 18 games it played; Cal won 9 of 18. We would like to use these data to test the Stanford fans' claim that Stanford's team is better than Cal's. That is, we would like to determine whether the difference between the two teams' performance reasonably could be attributed to chance, if the Stanford and Cal teams in fact have equal skill. Problem 1 The null hypothesis is that (Q1) the Stanford and Cal teams have the same skill v The alternative hypothesis is that (02) Stanford has the better team v To test the hypothesis, we shall make a number of simplifying assumptions. First of all, we shall ignore the fact that some of the games were played between Stanford and Cal: we shall pretend that all the games were played against other teams in the conference. One strong version of the hypothesis that the two teams have equal skill is that the outcomes of the games would have been the same had the two teams swapped schedules. That is, suppose that when Washington played Stanford on a particular day, Stanford won. Under this strong hypothesis, had Washington played Cal that day instead of Stanford, Cal would have won. A weaker version of the hypothesis is that the outcome of Stanford's games is determined by independent draws from a 0-1 box that has a fraction p0 of tickets labeled "1" (Stanford wins the game if the ticket drawn is labeled "1"), that the outcome of Berkeley's games is determined similarly, by independent draws from a 0-1 box with a fraction p3 of tickets labeled "1," and that p3 = pc. This model has some shortcomings. (For instance, when Berkeley and Stanford play each other, the independence assumption breaks down, and the fraction of tickets labeled "1" would need to be 50%. Also, it seems unreasonable to think that the chance of winning does not depend on the opponent. We could refine the model, but that would require knowing more details about who played whom, and the outcome.) Nonetheless, this model does shed some light on how surprising the records would be if the teams were, in some sense, equally skilled. This box model version allows us to use Fisher's Exact test for independent samples, considering "treatment" to be playing against Stanford, and "control" to be playing against Cal, and conditioning on the total number of wins by both teams (26). lI (D about:blank but that would require knowing more details about who played whom, and the outcome.) Nonetheless, this model does shed some light on how surprising the records would be if the teams were, in some sense, equally skilled. This box model version allows us to use Fisher's Exact test for independent samples, considering "treatment" to be playing against Stanford, and "control" to be playing against Cal, and conditioning on the total number of wins by both teams (26). Problem 2 The test siatistic is (as) If the null hypothesis is true, the test statistic has a (Q4) hypergeometric v distribution with parameter(s) (05) N=36, G=26, n=17 v Problem 3 The Pvalue for a one-sided test against the alternative hypothesis that the Stanford team is better than the Cal team is (06) At significance level 1%, we should reject the null hypothesis. (Q7) false v Problem 4 If the null hypothesis is true, the expected value of the test statistic is (OS) 5.5 and the standard error of the test statistic is (09) The zscore of the test statistic is (010) The normal approximation to the P-value for Fisher's exact test against the alternative that the Stanford team is better than the Berkeley team is (011) 10506552 Now consider the ztest using independent samples. We pretend that each team's wins and losses are independent random samples with replacement from 0-1 boxes in which the fraction of ones represents the probability that that team wins each game it plays. The number of tickets labeled "1" in the sample is the number of games the team wins. | Problem 5 l (D about:blank Problem 4 If the null hypothesis is true, the expected value of the test statistic is (08) . and the standard error of the test statistic is (09) 15189281 The z-soore ot the test statistic is (Q10) The normal approximation to the P-value tor Fisher's exact test against the alternative that the Stanford team is better than the Berkeley team is (011) 10.506552 Now consider the ztest using independent samples. We pretend that each team's wins and losses are independent random samples with replacement from 0-1 boxes in which the fraction of ones represents the probability that that team wins each game it plays. The number of tickets labeled "1" in the sample is the number of games the team wins. Problem 5 The sample percentage of games won by Stanford is (Q12) On the assumption that the null hypothesis is true, the bootstrap estimate of the standard error of the sample percentage of games won by Stanford is (013) (Hint: if the null hypothesis is true, then with the simplifications we made it is as if the teams independent/y draw at random with replacement from the same box of tickets. What percentage of the tickets in that box would you estimate to be labeled "17") The sample percentage of games won by Cal is (014) On the assumption that the null hypothesis is true, the bootstrap estimate of the standard error of the sample percentage of games won by Cal is (015) The difference in sample percentages of games won by Stanford and Cal is (Qt 6) 0.444444 0n the assumption that the null hypothesis is true, the bootstrap estimate of the standard error of the difference in sample percentages is (Q17) 0.022290 The z-score tor the difference in sample percentages is (Q18) 0.0015 The approximate P-value for ztest against the two-sided alternative that the Stanford and Berkeley teams have different skills is (019) At significance level 5%, we should reject the null hypothesis. (020) Submit for Grading Save Answers