(d) Another neighborhood has a crime rate of 75 crimes per 1000 population. Does this crime rate seem to be higher than the population average?
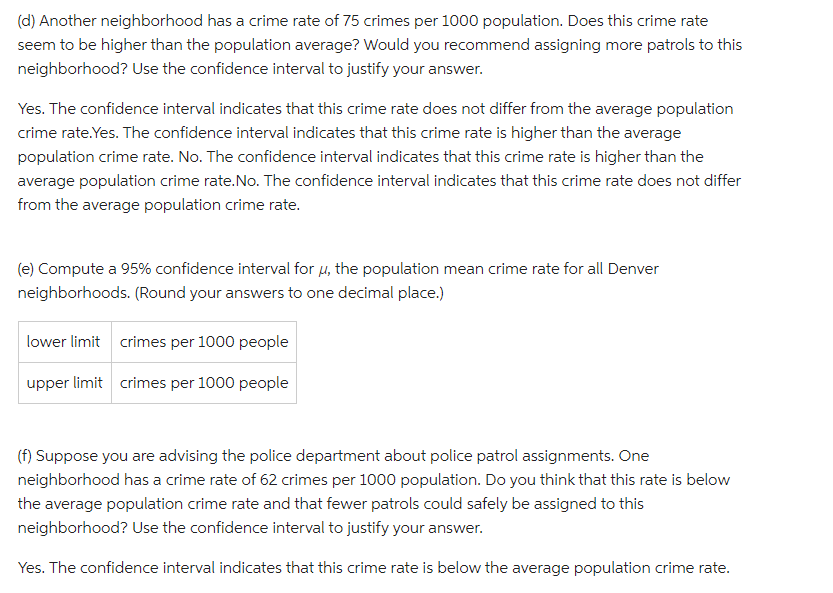
(d) Another neighborhood has a crime rate of 75 crimes per 1000 population. Does this crime rate seem to be higher than the population average? Would you recommend assigning more patrols to this neighborhood? Use the confidence interval to justify your answer. Yes. The confidence interval indicates that this crime rate does not differ from the average population crime rate.Yes. The confidence interval indicates that this crime rate is higher than the average population crime rate. No. The confidence interval indicates that this crime rate is higher than the average population crime rate. No. The confidence interval indicates that this crime rate does not differ from the average population crime rate. (e) Compute a 95% confidence interval for N, the population mean crime rate for all Denver neighborhoods. (Round your answers to one decimal place.) lower limit crimes per 1000 people upper limit crimes per 1000 people (f) Suppose you are advising the police department about police patrol assignments. One neighborhood has a crime rate of 62 crimes per 1000 population. Do you think that this rate is below the average population crime rate and that fewer patrols could safely be assigned to this neighborhood? Use the confidence interval to justify your answer. Yes. The confidence interval indicates that this crime rate is below the average population crime rate.
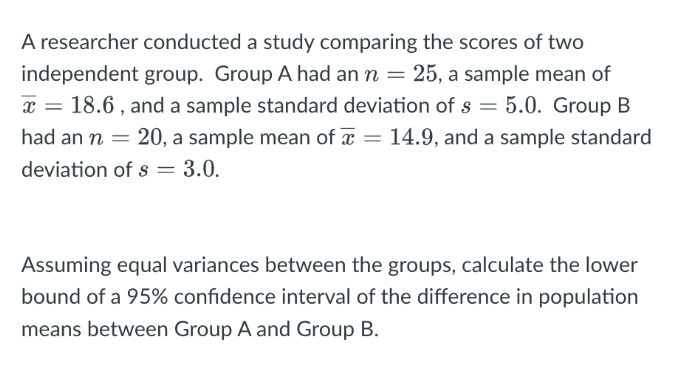
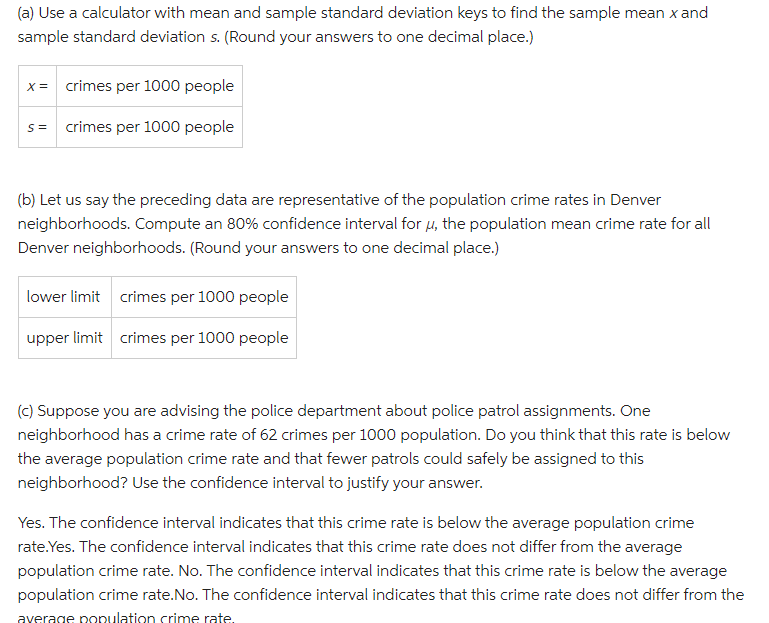
A researcher conducted a studv comparing the scores of two independent group. Group A had an n : 25. a sample mean of E = 18.6 . and a sample standard deviation of .s = 5.0. Group B had an n = 20, a sample mean ofE = 14.9, and a sample standard deviation of .s = 3.0. Assuming equal variances between the groups. calculate the lower bound of a 95% condence interval of the difference in population means between Group A and Group B. {a} Use a calculator with mean and sample standard deviation keys to find the sample mean xand sample standard deviation s. {Round your answers to one decimal place.} A" = crimes per IODD people s = crimes per IODD people {b} Let us sayr the preceding data are representative of the population crime rates in Denver neighborhoods. Compute an 8D% confidence interval for p, the population mean crime rate for all Denver neighborhoods. [Round your answers to one decimal place.) lower limit crimes per 1DCIO people upper limit crimes per 1DCIO people {c} Suppose you are advising the police department about police patrol assignments. IDne neighborhood has a crime rate of 62 crimes per 1001:] population. Do you thinkthat this rate is below the average population crime rate and that fewer patrols. could safely be assigned to this neighborhood? Use the confidence interval to justify your answer. Yes. The confidence interval indicates that this crime rate is below the average population crime rate.Yes. The confidence interval indicates that this crime rate does not differ from the average population crime rate. No. The confidence interval indicates that this crime rate is below the average population crime rate.No. The confidence interval indicates that this crime rate does not differ from the averaoe nonulatinn crime rate. {d} Another neighborhood has a crime rate of T5 crimes per 1000 population. Does this crime rate seem to be higherthan the population average? Would you recommend assigning more patrols to this neighborhood? Use the confidence interval to justify your answer. Yes. The confidence interval indicates that this crime rate does not differ from the average population crime rate.'r'es. The confidence interval indicates that this crime rate is higher than the average population crime rate. No. The confidence interval indicates thatthis crime rate is higherthan the average population crime rate.No. The confidence interval indicates that this crime rate does not differ from the average population crime rate. :[e] Compute a 95% confidence interval for ,u, the population mean crime rate for all Denver neighborhoods. [Round your answers to one decimal place.) lower limit crimes per 1000 people upper limit crimes per 1000 people if) Suppose you are advising the police department about police patrol assignments. One neighborhood has a crime rate of 62 crimes per 1000 population. Do you thinkthat this rate is below the average population crime rate and that fewer patrols could safely be assigned tothis neighborhood? Use the confidence interval to justify your answer. Yes. The confidence interval indicates that this crime rate is below the average population crime rate. \fA researcher examined the effects of fertilizer on strawberry weight. She studied a control group of strawberries and a group of strawberries who had been raised on fertilizer. She conducted a two-sample Student's t-test to examine differences between the two groups. These are the data from each group and the summary information: Control: 11,12, 11.5, 10, 12, 12.5 Mean = 11.5 sd = 0.89 df =5 Fertilizer: 14, 13.5, 12.5, 15, 15.5, 15, 13.5 Mean = 14.14 sd =1.07 df =6 Calculate the Cohen's effect size o for this Student's t-test. Make sure to give your answer as a positive value.Which of the following is a statistical test that can be carried out to determine if a sample of data are likely to come from a population that is approximately normally distributed? O Levene test O t-test O Shapiro-Wilk test O Wilcoxon testThe Student's t-test and Welch's t-test are both independent t-tests. What assumption does the Student's t-test make that the Welch's t-test does not? O The populations you are comparing have different means O The populations you are comparing have the the same means O The populations you are comparing have the same variances O The populations you are comparing have different variances\fUse the Student's t distribution to find to for a 0.95 confidence level when the sample is 22. (Round your answer to three decimal places.) Use the Student's t distribution to find to for a 0.99 confidence level when the sample is 13. (Round your answer to three decimal places.) Use the Student's t distribution to find to for a 0.90 confidence level when the sample is 22. (Round your answer to three decimal places.) As the degrees of freedom increase, what distribution does the Student's t distribution become more like? chi-square standard normal uniform binomial How much does a sleeping bag cost? Let's say you want a sleeping bag that should keep you warm in temperatures from 20'F to 45"F. A random sample of prices ($) for sleeping bags in this temperature range is given below. Assume that the population of x values has an approximately normal distribution.How much does a sleeping bag cost? Let's say vou want a sleeping bag that should keep you warm in temperatures from 20F to 45F. A random sample of prices [5} for sleeping bags in this temperature range is given below. Assu me that the population of xvalues has an approximately normal distribution. 50 11E}I 100 55 110 35 30 23 100 11C:I 105 95 105 50 110 120 5'5 90 50 TD {ai Use a calculator with mean and sample standard deviation kevs to find the sample mean price X and sample standard deviation s. [Round vouranswers to two decimal places} {lo} Using the given data as representative ofthe population of prices of all summer sleeping bags, find a 90% confidence interval forthe mean price pot all summer sleeping bags. {Round vour answers to two decimal places.) lower limit 5 upper limit 5 \f{c} Based on your results in part {b}, do you thinlc this patient still has a calcium deficiency? Explain. Yes. This confidence interval suggests that the patient may still have a calcium deficiency. Yes. This confidence interval suggests that the patient no longer has a calcium deficiency. No. This confidence interval suggests that the patient may still have a calcium deficiency. No. This confidence interval suggests that the patient no longer has a calcium deficiency. The following data represent crime rates per 1008 population for a random sample of 46 Denver neighborhoodsf 63.2 36.3 25.2 53.2 55.3 32.8 55.0 55.3 58.9 35.2 25.1 32.5 54.8 42.4 ??.5 123.2 65.3 92.? 56.9 ??.1 2?.5 69.2 ?3.8 ?1.5 58.5 5?.2 ?8.5 33.2 ?4.9 45.1 13 2.1 184.? 53.2 59.5 ?5.? 39.2 59.9 8?.5 56.8| 154.2 85.5 ??.5 84.? 24.2 3?.5 4
Step by Step Solution
There are 3 Steps involved in it
Step: 1
Get Instant Access to Expert-Tailored Solutions
See step-by-step solutions with expert insights and AI powered tools for academic success
Step: 2
Step: 3
Ace Your Homework with AI
Get the answers you need in no time with our AI-driven, step-by-step assistance