

Answered step by step
Verified Expert Solution
Question
1 Approved Answer
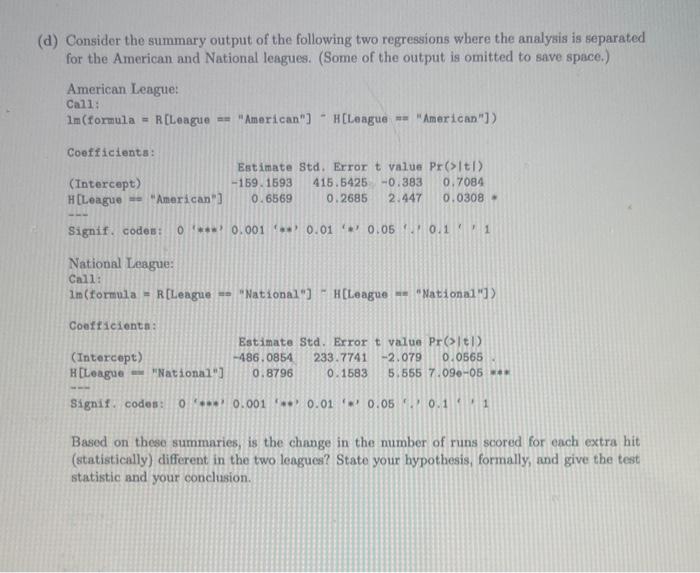
(d) Consider the summary output of the following two regressions where the analysis is separated for the American and National leagues. (Some of the output
Step by Step Solution
There are 3 Steps involved in it
Step: 1

Get Instant Access to Expert-Tailored Solutions
See step-by-step solutions with expert insights and AI powered tools for academic success
Step: 2

Step: 3
Ace Your Homework with AI
Get the answers you need in no time with our AI-driven, step-by-step assistance
Get Started
The Palgrave International Handbook Of Basic Income
Authors: Malcolm Torry
1st Edition
3030236137, 978-3030236137