Answered step by step
Verified Expert Solution
Question
1 Approved Answer
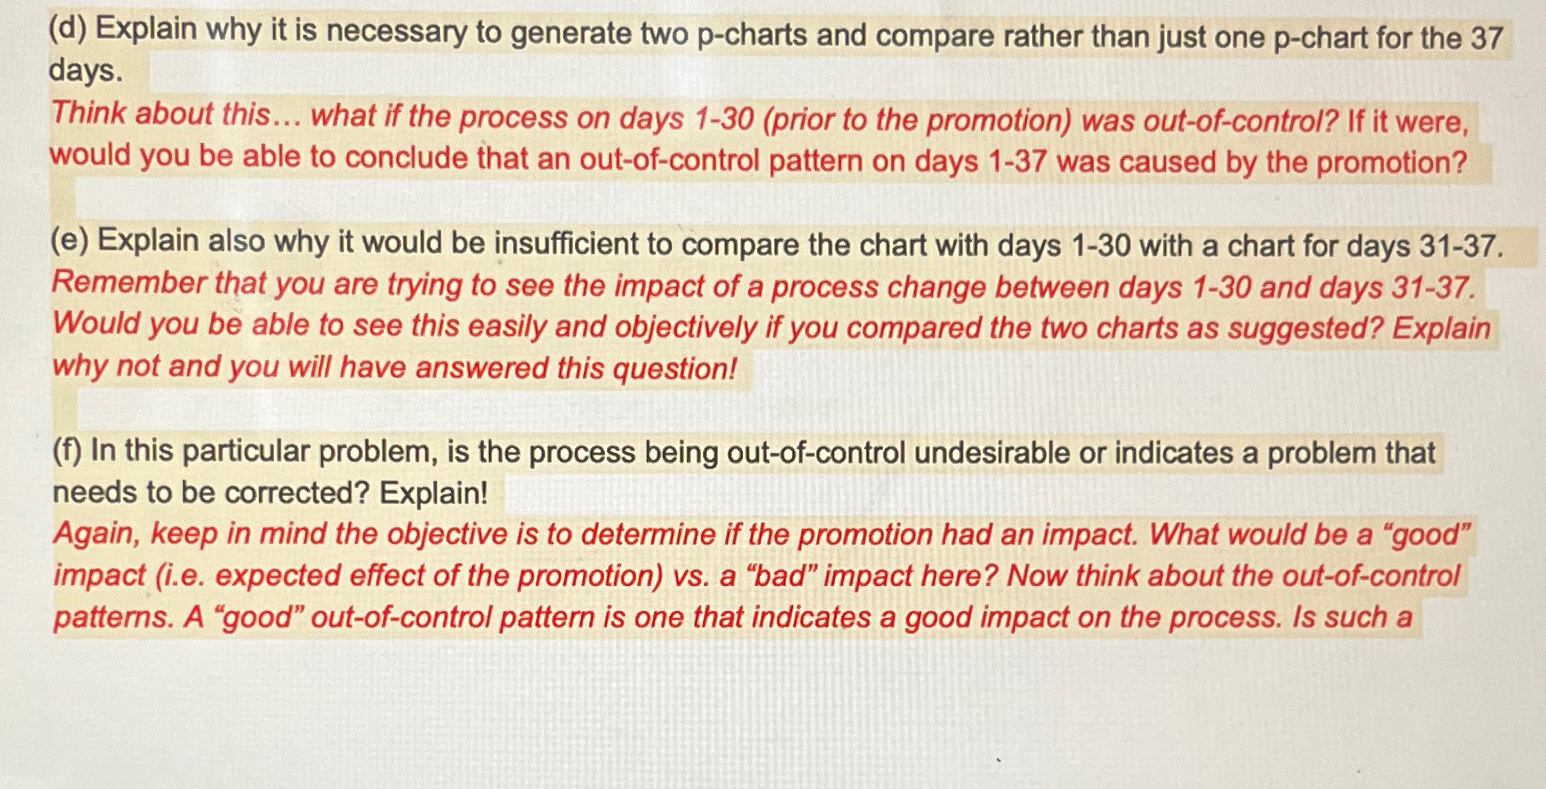
( d ) Explain why it is necessary to generate two p - charts and compare rather than just one p - chart for the
d Explain why it is necessary to generate two charts and compare rather than just one chart for the days.
Think about this... what if the process on days prior to the promotion was outofcontrol? If it were, would you be able to conclude that an outofcontrol pattern on days was caused by the promotion?
e Explain also why it would be insufficient to compare the chart with days with a chart for days Remember that you are trying to see the impact of a process change between days and days Would you be able to see this easily and objectively if you compared the two charts as suggested? Explain why not and you will have answered this question!
f In this particular problem, is the process being outofcontrol undesirable or indicates a problem that needs to be corrected? Explain!
Again, keep in mind the objective is to determine if the promotion had an impact. What would be a "good" impact ie expected effect of the promotion vs a "bad" impact here? Now think about the outofcontrol patterns. A "good" outofcontrol pattern is one that indicates a good impact on the process. Is such a

Step by Step Solution
There are 3 Steps involved in it
Step: 1

Get Instant Access to Expert-Tailored Solutions
See step-by-step solutions with expert insights and AI powered tools for academic success
Step: 2

Step: 3

Ace Your Homework with AI
Get the answers you need in no time with our AI-driven, step-by-step assistance
Get Started


