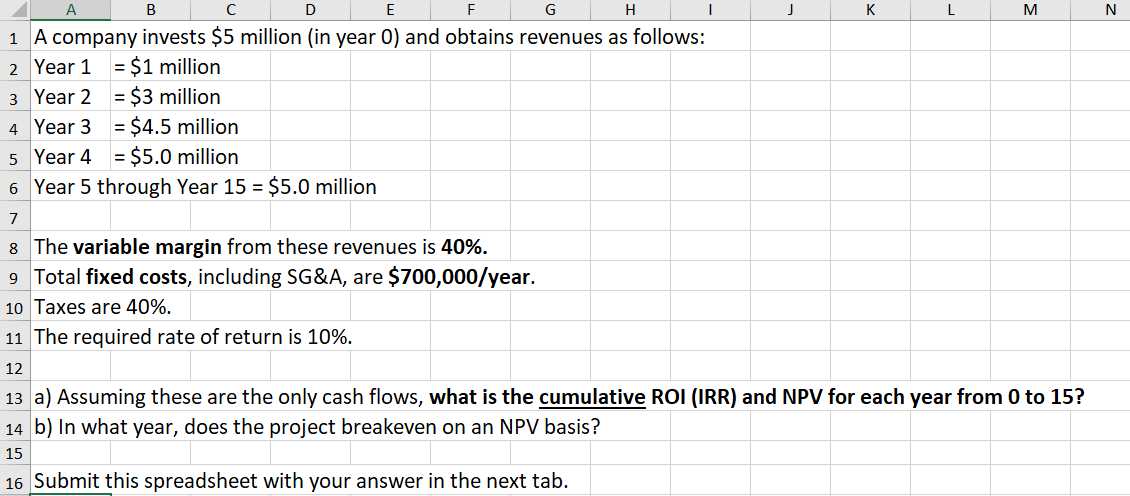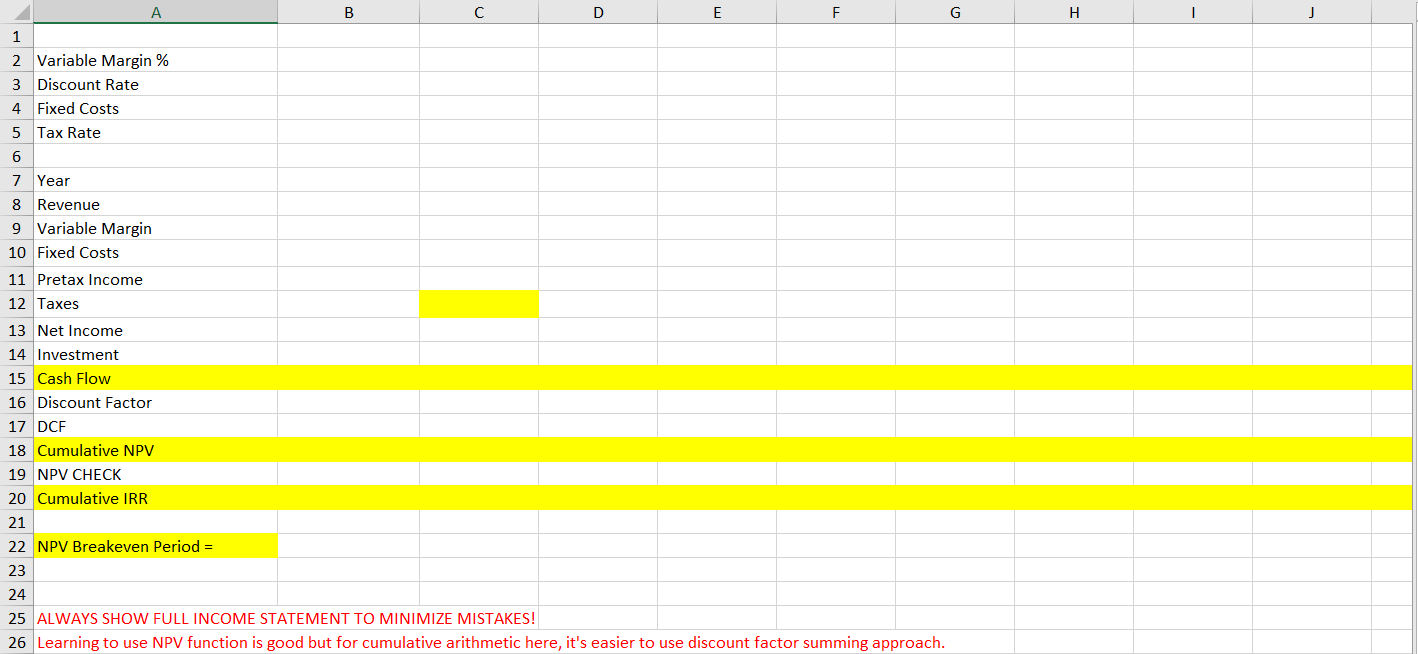


D G H J K L M N B E F 1 A company invests $5 million (in year 0) and obtains revenues as follows: 2 Year 1 = $1 million 3 Year 2 = $3 million 4. Year 3 = $4.5 million 5 Year 4 = $5.0 million 6 Year 5 through Year 15 = $5.0 million 7 8 The variable margin from these revenues is 40%. 9 Total fixed costs, including SG&A, are $700,000/year. 10 Taxes are 40%. 11 The required rate of return is 10%. 12 13 a) Assuming these are the only cash flows, what is the cumulative ROI (IRR) and NPV for each year from 0 to 15? 14 b) In what year, does the project breakeven on an NPV basis? 15 16 Submit this spreadsheet with your answer in the next tab. B D w F G H - J 1 2 Variable Margin % 3 Discount Rate 4 Fixed Costs 5 Tax Rate 6 7 Year 8 Revenue 9 Variable Margin 10 Fixed Costs 11 Pretax Income 12 Taxes 13 Net Income 14 Investment 15 Cash Flow 16 Discount Factor 17 DCF 18 Cumulative NPV 19 NPV CHECK 20 Cumulative IRR 21 22 NPV Breakeven Period = 23 24 25 ALWAYS SHOW FULL INCOME STATEMENT TO MINIMIZE MISTAKES! 26 Learning to use NPV function is good but for cumulative arithmetic here, it's easier to use discount factor summing approach. G H 1 J K L M N 0 P Q 15 5 $5,000,000 $3,000,000 $700,000 1,300,000 520,000 780,000 6 $5,000,000 $3,000,000 $700,000 1,300,000 520,000 780,000 7 $5,000,000 $3,000,000 $700,000 1,300,000 520,000 780,000 8 $5,000,000 $3,000,000 $700,000 1,300,000 520,000 780,000 9 $5,000,000 $3,000,000 $700,000 1,300,000 520,000 780,000 10 $5,000,000 $3,000,000 $700,000 1,300,000 520,000 780,000 11 $5,000,000 $3,000,000 $700,000 1,300,000 520,000 12 $5,000,000 $3,000,000 $700,000 1,300,000 520,000 780,000 13 $5,000,000 $3,000,000 $700,000 1,300,000 520,000 780,000 14 $5,000,000 $3,000,000 $700,000 1,300,000 520,000 780,000 $5,000,000 $3,000,000 $700,000 1,300,000 520,000 780,000 780,000 A B D E F 1 2 Variable Margin % 40% 3 Discount Rate 10% 4 Fixed Costs 700000 5 Tax Rate 40% 6 7 Year 0% 1 2 3 4 8 Revenue $1,000,000 $3,000,000 $4,500,000 $5,000,000 9 Variable Margin $600,000 $1,800,000 $2,700,000 $3,000,000 10 Fixed Costs $700,000 $700,000 $700,000 $700,000 11 Pretax Income (300,000) 500,000 1,100,000 1,300,000 12 Taxes 200,000 440,000 520,000 13 Net Income (300,000) 300,000 660,000 780,000 14 Investment -5000000 15 Cash Flow -$5,000,000 -$5,300,000 -$5,000,000 -$4,340,000 -$3,560,000 16 Discount Factor 17 DCF 18 Cumulative NPV (12,912,691) (4,818,182) (4,132,231) (3,260,706) (2,431,528) 19 NPV CHECK 20 Cumulative IRR -3% 21 22 NPV Breakeven Period = 23 24 25 ALWAYS SHOW FULL INCOME STATEMENT TO MINIMIZE MISTAKES! 26 Learning to use NPV function is good but for cumulative arithmetic here, it's easier to use discount factor summing approach. 27 28 -$2,780,000 -$2,000,000 -$1,220,000 -$440,000 $340,000 $1,120,000 $1,900,000 $2,680,000 $3,460,000 $4,240,000 $5,020,000 (1,726,161) (1,128,948) (626,053) (205,263) 144,193 431,808 665,938 853,931 1,002,239 1,116,525 1,201,748 D G H J K L M N B E F 1 A company invests $5 million (in year 0) and obtains revenues as follows: 2 Year 1 = $1 million 3 Year 2 = $3 million 4. Year 3 = $4.5 million 5 Year 4 = $5.0 million 6 Year 5 through Year 15 = $5.0 million 7 8 The variable margin from these revenues is 40%. 9 Total fixed costs, including SG&A, are $700,000/year. 10 Taxes are 40%. 11 The required rate of return is 10%. 12 13 a) Assuming these are the only cash flows, what is the cumulative ROI (IRR) and NPV for each year from 0 to 15? 14 b) In what year, does the project breakeven on an NPV basis? 15 16 Submit this spreadsheet with your answer in the next tab. B D w F G H - J 1 2 Variable Margin % 3 Discount Rate 4 Fixed Costs 5 Tax Rate 6 7 Year 8 Revenue 9 Variable Margin 10 Fixed Costs 11 Pretax Income 12 Taxes 13 Net Income 14 Investment 15 Cash Flow 16 Discount Factor 17 DCF 18 Cumulative NPV 19 NPV CHECK 20 Cumulative IRR 21 22 NPV Breakeven Period = 23 24 25 ALWAYS SHOW FULL INCOME STATEMENT TO MINIMIZE MISTAKES! 26 Learning to use NPV function is good but for cumulative arithmetic here, it's easier to use discount factor summing approach. G H 1 J K L M N 0 P Q 15 5 $5,000,000 $3,000,000 $700,000 1,300,000 520,000 780,000 6 $5,000,000 $3,000,000 $700,000 1,300,000 520,000 780,000 7 $5,000,000 $3,000,000 $700,000 1,300,000 520,000 780,000 8 $5,000,000 $3,000,000 $700,000 1,300,000 520,000 780,000 9 $5,000,000 $3,000,000 $700,000 1,300,000 520,000 780,000 10 $5,000,000 $3,000,000 $700,000 1,300,000 520,000 780,000 11 $5,000,000 $3,000,000 $700,000 1,300,000 520,000 12 $5,000,000 $3,000,000 $700,000 1,300,000 520,000 780,000 13 $5,000,000 $3,000,000 $700,000 1,300,000 520,000 780,000 14 $5,000,000 $3,000,000 $700,000 1,300,000 520,000 780,000 $5,000,000 $3,000,000 $700,000 1,300,000 520,000 780,000 780,000 A B D E F 1 2 Variable Margin % 40% 3 Discount Rate 10% 4 Fixed Costs 700000 5 Tax Rate 40% 6 7 Year 0% 1 2 3 4 8 Revenue $1,000,000 $3,000,000 $4,500,000 $5,000,000 9 Variable Margin $600,000 $1,800,000 $2,700,000 $3,000,000 10 Fixed Costs $700,000 $700,000 $700,000 $700,000 11 Pretax Income (300,000) 500,000 1,100,000 1,300,000 12 Taxes 200,000 440,000 520,000 13 Net Income (300,000) 300,000 660,000 780,000 14 Investment -5000000 15 Cash Flow -$5,000,000 -$5,300,000 -$5,000,000 -$4,340,000 -$3,560,000 16 Discount Factor 17 DCF 18 Cumulative NPV (12,912,691) (4,818,182) (4,132,231) (3,260,706) (2,431,528) 19 NPV CHECK 20 Cumulative IRR -3% 21 22 NPV Breakeven Period = 23 24 25 ALWAYS SHOW FULL INCOME STATEMENT TO MINIMIZE MISTAKES! 26 Learning to use NPV function is good but for cumulative arithmetic here, it's easier to use discount factor summing approach. 27 28 -$2,780,000 -$2,000,000 -$1,220,000 -$440,000 $340,000 $1,120,000 $1,900,000 $2,680,000 $3,460,000 $4,240,000 $5,020,000 (1,726,161) (1,128,948) (626,053) (205,263) 144,193 431,808 665,938 853,931 1,002,239 1,116,525 1,201,748


