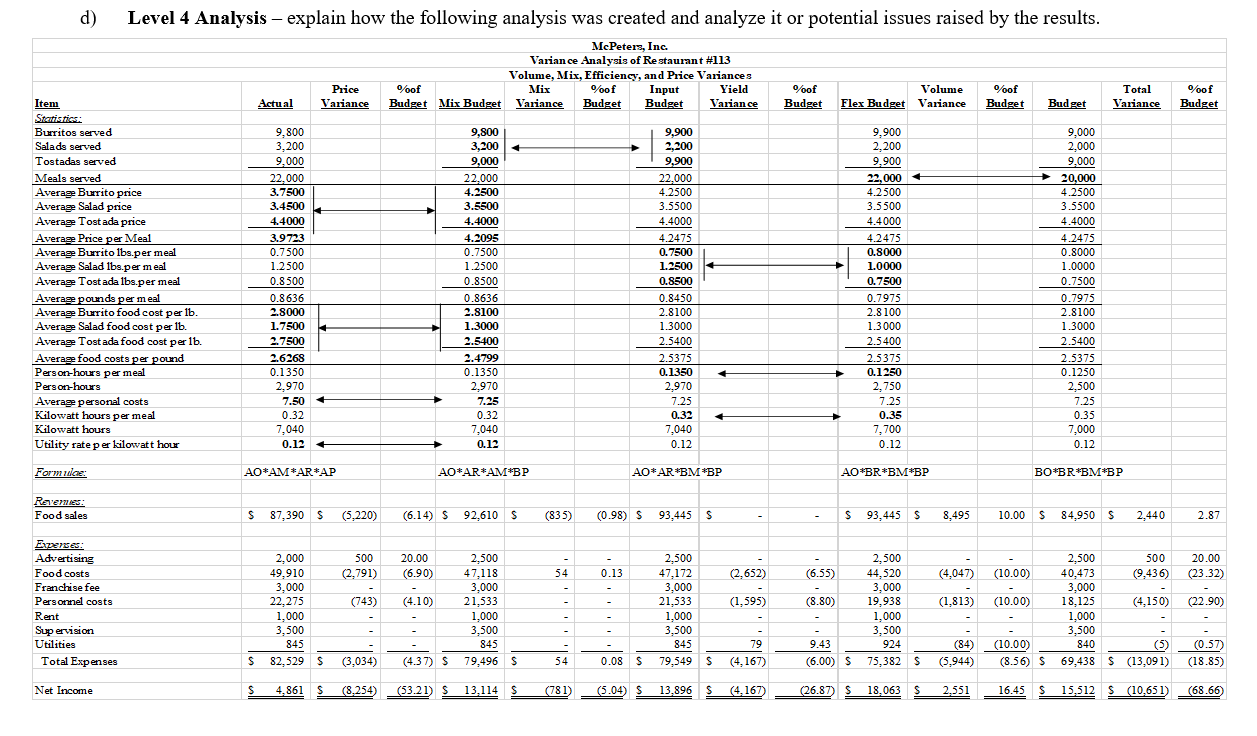
d) Level 4 Analysis explain how the following analysis was created and analyze it or potential issues raised by the results. McPeters, Inc. Variance Analysis of Restaurant #113 Volume, Mix, Efficiency, and Price Variances %of Mix %of Input Yield Budget Mix Budget Variance Budget Budget Variance %oof Price Variance %of Budget Volume Flex Budget Variance Total Variance %of Budget Actual Budget Budget Item Statistics: Burritos served Salads served Tostadas served Meals served Average Burrito price Average Salad price Average Tostada price Average Price per Meal Average Burrito lbs.per meal Average Salad lbs.per meal Average Tost ada lbs.per meal Average pounds per meal Average Burrito food cost per lb. Average Salad food cost per lb. Average Tost ada food cost per lb. Average food costs per pound Person-hours per meal Person-hours Average personal costs Kilowatt hours per meal Kilowatt hours Utility rate per kilowatt hour 9,800 3,200 9,000 22.000 3.7500 3.4500 4.4000 3.9723 0.7500 1.2 500 0.8500 0.8636 2.8000 1.7500 2.7500 2.6268 0.1350 2.970 7.50 0.32 7,040 0.12 9,800 3,200 9,000 22,000 4.2500 3.5500 4.4000 4.2095 0.7500 1.2500 0.8500 0.8636 2.8100 1.3000 2.5400 2.4799 0.1350 2.970 7.25 0.32 7,040 0.12 9,900 2,200 9,900 22,000 4.2500 3.5500 4.4000 4.2475 0.7500 1.2500 0.8500 0.8450 2.8100 1.3000 2.5400 2.5375 0.1350 2.970 7.25 0.32 7,040 0.12 9,900 2,200 9.900 22,000 4.2 500 3.5500 4.4000 4.2475 0.8000 1.0000 0.7500 0.7975 2.8100 1.3000 2.5400 2.5375 0.1250 2.750 7.25 0.35 7,700 0.12 9,000 2,000 9,000 20,000 4.2500 3.5500 4.4000 4.2475 0.8000 1.0000 0.7500 0.7975 2.8100 1.3000 2.5400 2.5375 0.1250 2.500 7.25 0.35 7,000 0.12 Formula AO*AM*AR*AP A0*ARAM*BP 40*AR BMBP A0*BR*BM*BP BO*BR*BM*BP Rames Food sales $ 87,390 S (5,220) (6.14) $ 92,610 S (835) (0.98) S 93,445 $ . S 93,445 S 8,495 10.00 $ 84,950 $ 2.440 2.87 500 (2.791) 20.00 (6.90) 20.00 (23.32) 54 0.13 (2,652) (6.55) (4,047) (10.00) (9,436) Experzes: Advertising Food costs Franchise fee Personnel costs Rent Supervision Utilities Total Expenses (743) (4.10) (1,595) (8.80) (1,813) (10.00) (22.90) 2.000 49,910 3,000 22,275 1,000 3,500 845 82,529 5 2,500 47,118 3,000 21,533 1,000 3,500 845 79,496 $ 2,500 47,172 3,000 21,533 1,000 3,500 845 79,549 $ 2,500 44, 520 3,000 19,938 1,000 3,500 924 75,382 S 2,500 500 40,473 3,000 18.125 (4,150) 1,000 3,500 840 (5) 69,438 S (13,091) (84) 79 (4.167) 9.43 (6.00) S (10.00) (8.56) S (0.57) (18.85) S (3,034) (4.37) S 54 0.08 $ (5,944) Net Income S 4,861 S (8.254) (53.21) S 13.114 S (781) (5.04) $ 13.896 $ (4.167) (26.87 S 18,063 S 2.551 16.45 S $ 15,512 $ (10,651) (68.66) d) Level 4 Analysis explain how the following analysis was created and analyze it or potential issues raised by the results. McPeters, Inc. Variance Analysis of Restaurant #113 Volume, Mix, Efficiency, and Price Variances %of Mix %of Input Yield Budget Mix Budget Variance Budget Budget Variance %oof Price Variance %of Budget Volume Flex Budget Variance Total Variance %of Budget Actual Budget Budget Item Statistics: Burritos served Salads served Tostadas served Meals served Average Burrito price Average Salad price Average Tostada price Average Price per Meal Average Burrito lbs.per meal Average Salad lbs.per meal Average Tost ada lbs.per meal Average pounds per meal Average Burrito food cost per lb. Average Salad food cost per lb. Average Tost ada food cost per lb. Average food costs per pound Person-hours per meal Person-hours Average personal costs Kilowatt hours per meal Kilowatt hours Utility rate per kilowatt hour 9,800 3,200 9,000 22.000 3.7500 3.4500 4.4000 3.9723 0.7500 1.2 500 0.8500 0.8636 2.8000 1.7500 2.7500 2.6268 0.1350 2.970 7.50 0.32 7,040 0.12 9,800 3,200 9,000 22,000 4.2500 3.5500 4.4000 4.2095 0.7500 1.2500 0.8500 0.8636 2.8100 1.3000 2.5400 2.4799 0.1350 2.970 7.25 0.32 7,040 0.12 9,900 2,200 9,900 22,000 4.2500 3.5500 4.4000 4.2475 0.7500 1.2500 0.8500 0.8450 2.8100 1.3000 2.5400 2.5375 0.1350 2.970 7.25 0.32 7,040 0.12 9,900 2,200 9.900 22,000 4.2 500 3.5500 4.4000 4.2475 0.8000 1.0000 0.7500 0.7975 2.8100 1.3000 2.5400 2.5375 0.1250 2.750 7.25 0.35 7,700 0.12 9,000 2,000 9,000 20,000 4.2500 3.5500 4.4000 4.2475 0.8000 1.0000 0.7500 0.7975 2.8100 1.3000 2.5400 2.5375 0.1250 2.500 7.25 0.35 7,000 0.12 Formula AO*AM*AR*AP A0*ARAM*BP 40*AR BMBP A0*BR*BM*BP BO*BR*BM*BP Rames Food sales $ 87,390 S (5,220) (6.14) $ 92,610 S (835) (0.98) S 93,445 $ . S 93,445 S 8,495 10.00 $ 84,950 $ 2.440 2.87 500 (2.791) 20.00 (6.90) 20.00 (23.32) 54 0.13 (2,652) (6.55) (4,047) (10.00) (9,436) Experzes: Advertising Food costs Franchise fee Personnel costs Rent Supervision Utilities Total Expenses (743) (4.10) (1,595) (8.80) (1,813) (10.00) (22.90) 2.000 49,910 3,000 22,275 1,000 3,500 845 82,529 5 2,500 47,118 3,000 21,533 1,000 3,500 845 79,496 $ 2,500 47,172 3,000 21,533 1,000 3,500 845 79,549 $ 2,500 44, 520 3,000 19,938 1,000 3,500 924 75,382 S 2,500 500 40,473 3,000 18.125 (4,150) 1,000 3,500 840 (5) 69,438 S (13,091) (84) 79 (4.167) 9.43 (6.00) S (10.00) (8.56) S (0.57) (18.85) S (3,034) (4.37) S 54 0.08 $ (5,944) Net Income S 4,861 S (8.254) (53.21) S 13.114 S (781) (5.04) $ 13.896 $ (4.167) (26.87 S 18,063 S 2.551 16.45 S $ 15,512 $ (10,651) (68.66)


