

Answered step by step
Verified Expert Solution
Question
1 Approved Answer
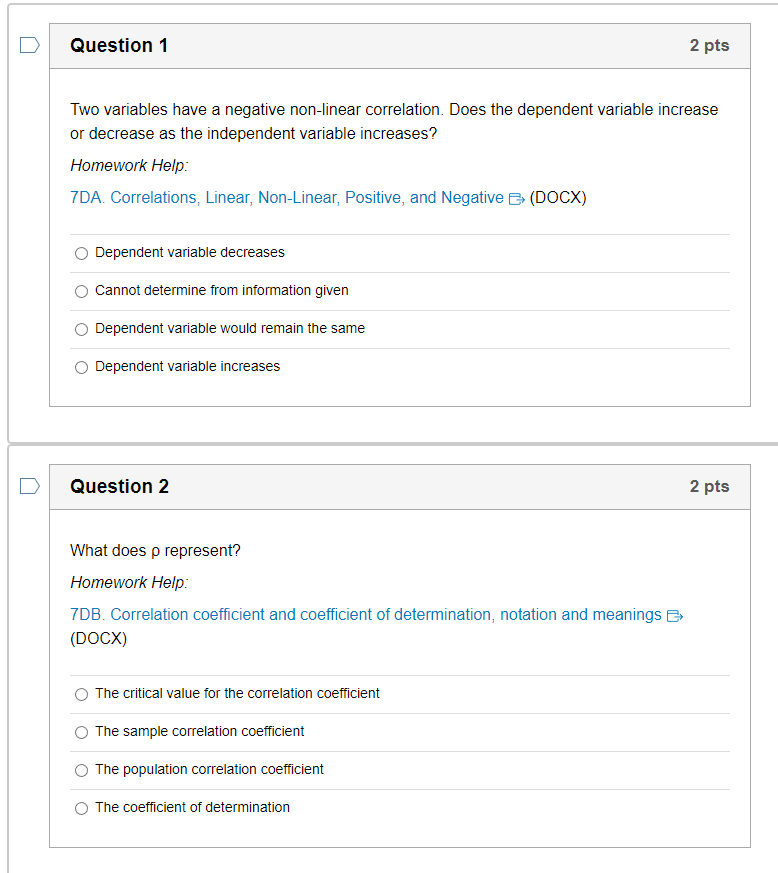
D Question 1 2 pts Two variables have a negative non-linear correlation. Does the dependent variable increase or decrease as the independent variable increases? Homework
Step by Step Solution
There are 3 Steps involved in it
Step: 1

Get Instant Access to Expert-Tailored Solutions
See step-by-step solutions with expert insights and AI powered tools for academic success
Step: 2

Step: 3
Ace Your Homework with AI
Get the answers you need in no time with our AI-driven, step-by-step assistance
Get Started
Linear Algebra with Applications
Authors: Steven J. Leon
7th edition
131857851, 978-0131857858