Answered step by step
Verified Expert Solution
Question
1 Approved Answer
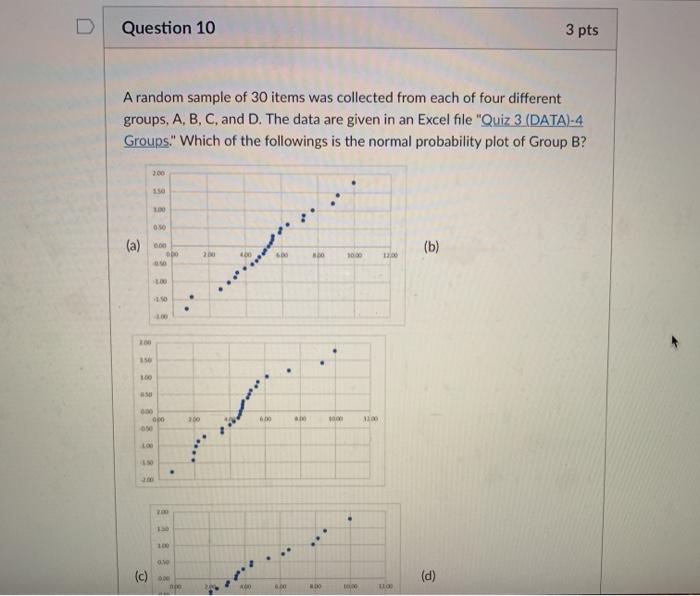
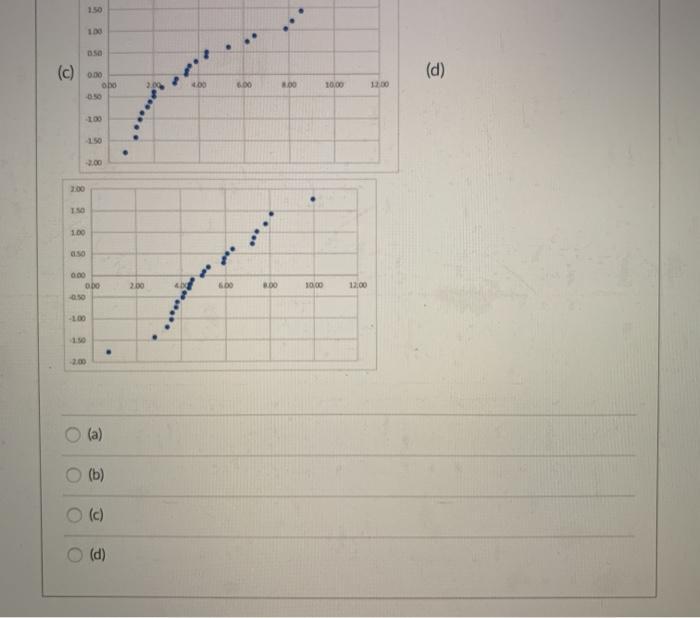
D Question 10 A random sample of 30 items was collected from each of four different groups, A, B, C, and D. The data


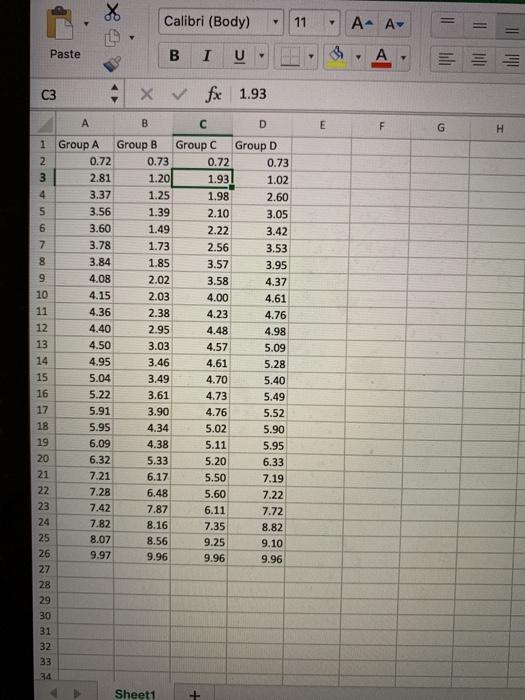
D Question 10 A random sample of 30 items was collected from each of four different groups, A, B, C, and D. The data are given in an Excel file "Quiz 3 (DATA)-4 Groups." Which of the followings is the normal probability plot of Group B? 200 150 0:50 (a) 6.00 0.50 850 1.00 200 150 100 600 (c) 050 L00 opo 4.50 4.00 4.50 100 100 0.10 0.00 noo . . 200 200 ***** A00 600 6.00 6.00 800 800 NDO 1000 10.00 1100 12,00 11:00 (b) 3 pts (d) 0.50 (c) 0.00 -0.50 1.50 2.00 1.00 01.50 -1.00 0.00 O -1.50 -0.50 O -2.00 -1.00 O 1.50 -2.00 O 1.00 000 obo . (e) (b) (c) (d) 2.00 .... 2.00 4.00 www. ******** *** 6.00 *** 6.00 .** 8.00 8.00 10,00 10,00 12,00 12:00 (d) C3 1 2 3 4 5 6 7 8 9 10 11 12 13 14 15 456 16 17 18 19 20 21 22 23 24 Paste 25 26 27 28 29 30 31 32 33 34 A Group A 5X 0.72 2.81 3.37 3.56 3.60 3.78 3.84 4.08 4.15 4.36 4.40 4.50 4.95 5.04 5.22 5.91 5.95 6.09 6.32 7.21 7.28 7.42 7.82 8.07 9.97 B Group B Calibri (Body) B X fx 0.73 1.20 1.25 1.39 1.49 1.73 1.85 2.02 2.03 2.38 2.95 3.03 3.46 3.49 3.61 3.90 4.34 4.38 5.33 6.17 6.48 7.87 8.16 8.56 9.96 Sheet1 I U C Group C + 0.72 1.93 1.98 2.10 2.22 2.56 3.57 3.58 4.00 4.23 4.48 4.57 4.61 4.70 4.73 4.76 5.02 5.11 5.20 5.50 5.60 6.11 7.35 9.25 9.96 1.93 Y D Group D 0.73 1.02 2.60 3.05 3.42 3.53 3.95 4.37 4.61 4.76 4.98 5.09 5.28 5.40 5.49 5.52 5.90 5.95 6.33 7.19 7.22 7.72 8.82 9.10 9.96 11 E Y A- A- B A Y F G 1|01 H
Step by Step Solution
★★★★★
3.49 Rating (166 Votes )
There are 3 Steps involved in it
Step: 1
The detailed answer for the above question is provided below Gr...
Get Instant Access to Expert-Tailored Solutions
See step-by-step solutions with expert insights and AI powered tools for academic success
Step: 2

Step: 3

Ace Your Homework with AI
Get the answers you need in no time with our AI-driven, step-by-step assistance
Get Started


