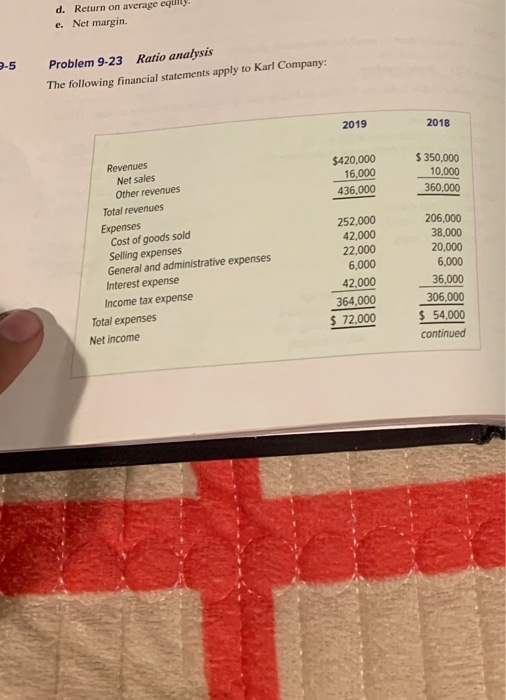
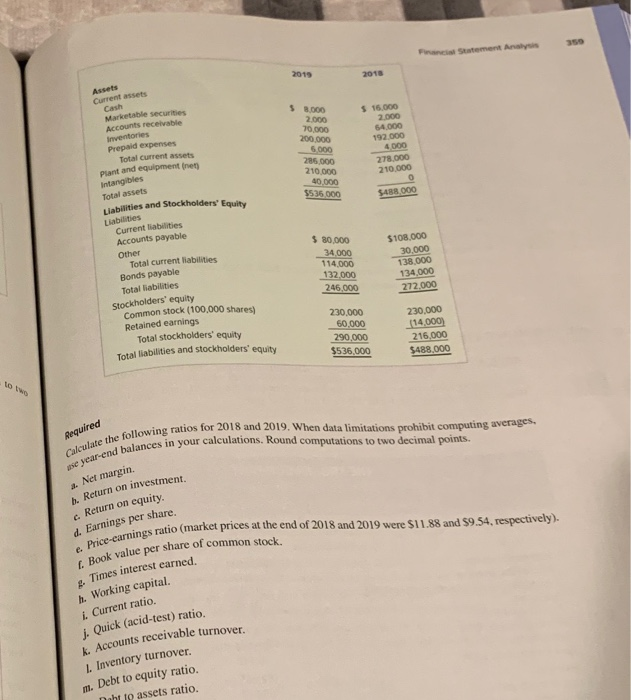
d. Return on average eqully. e. Net margin 2-5 Problem 9-23 Ratio analysis The following financial statements apply to Karl Company: 2019 2018 $420,000 16.000 436.000 $ 350,000 10,000 360,000 Revenues Net sales Other revenues Total revenues Expenses Cost of goods sold Selling expenses General and administrative expenses Interest expense Income tax expense Total expenses Net income 252,000 42.000 22.000 6,000 42.000 364,000 $ 72,000 206,000 38,000 20,000 6,000 36,000 306,000 $ 54,000 continued Fan Statement Analysis 2019 2018 Assets Current assets Cash Marketable securities Accounts receivable Inventories Prepaid expenses Total current assets plant and equipment nee $ 8.000 2.000 70,000 200.000 5.000 285.000 210.000 40 000 $535 000 $15.000 2.000 54 000 192.000 4000 278.000 210,000 Intangibles Total assets $488 000 Liabilities and Stockholders' Equity Liabilities $ 80.000 34.000 114.000 132.000 246,000 $108,000 30,000 138.000 134,000 272.000 Current liabilities Accounts payable Other Total current liabilities Bonds payable Total liabilities Stockholders' equity Common stock (100,000 shares) Retained earnings Total stockholders' equity Total liabilities and stockholders' equity 230,000 60,000 290,000 $536,000 230,000 114.000 216,000 $488.000 Required Calculate the following ratios for 2018 and 2019. When data limitations prohibit computing averages. use year-end balances in your calculations. Round computations to two decimal points. a. Net margin b. Return on investment, Return on equity. d. Earnings per share. Price-earnings ratio (market prices at the end of 2018 and 2019 were $11.88 and $9.54, respectively). 1. Book value per share of common stock. 9. Times interest earned h. Working capital. 1. Current ratio. j. Quick (acid-test) ratio k Accounts receivable turnover. 1. Inventory turnover. m. Debt to equity ratio naht to assets ratio