

Answered step by step
Verified Expert Solution
Question
1 Approved Answer
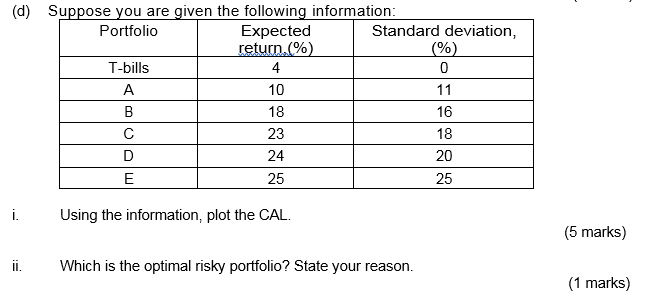
(d) Suppose you are given the following information: Portfolio Expected Standard deviation, return.(%) (%) T-bills 4 0 A 10 11 B 18 16 23 18
Step by Step Solution
There are 3 Steps involved in it
Step: 1

Get Instant Access to Expert-Tailored Solutions
See step-by-step solutions with expert insights and AI powered tools for academic success
Step: 2

Step: 3
Ace Your Homework with AI
Get the answers you need in no time with our AI-driven, step-by-step assistance
Get Started
Lectures On Public Economics
Authors: Anthony B. Atkinson, Joseph E. Stiglitz
1st Edition
0691166412, 978-0691166414