Question
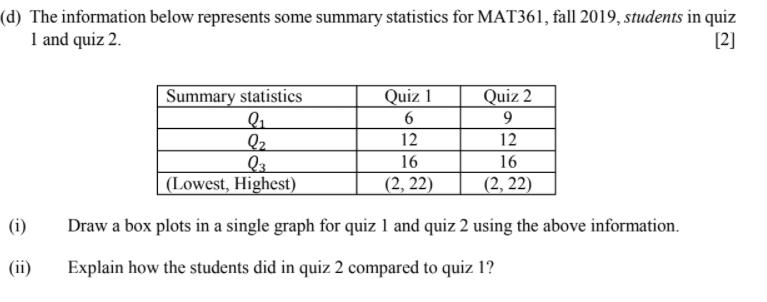
(d) The information below represents some summary statistics for MAT361, fall 2019, students in quiz 1 and quiz 2. [2] Summary statistics Quiz 1

(d) The information below represents some summary statistics for MAT361, fall 2019, students in quiz 1 and quiz 2. [2] Summary statistics Quiz 1 Quiz 2 6 9 Q2 12 12 16 16 (Lowest, Highest) (2, 22) (2, 22) (i) Draw a box plots in a single graph for quiz 1 and quiz 2 using the above information. (ii) Explain how the students did in quiz 2 compared to quiz 1?
Step by Step Solution
3.48 Rating (164 Votes )
There are 3 Steps involved in it
Step: 1
d i ii Even though the maximum score and median sco...
Get Instant Access to Expert-Tailored Solutions
See step-by-step solutions with expert insights and AI powered tools for academic success
Step: 2

Step: 3

Ace Your Homework with AI
Get the answers you need in no time with our AI-driven, step-by-step assistance
Get StartedRecommended Textbook for
A Pathway To Introductory Statistics
Authors: Jay Lehmann
1st Edition
0134107179, 978-0134107172
Students also viewed these Mathematics questions
Question
Answered: 1 week ago
Question
Answered: 1 week ago
Question
Answered: 1 week ago
Question
Answered: 1 week ago
Question
Answered: 1 week ago
Question
Answered: 1 week ago
Question
Answered: 1 week ago
Question
Answered: 1 week ago
Question
Answered: 1 week ago
Question
Answered: 1 week ago
Question
Answered: 1 week ago
Question
Answered: 1 week ago
Question
Answered: 1 week ago
Question
Answered: 1 week ago
Question
Answered: 1 week ago
Question
Answered: 1 week ago
Question
Answered: 1 week ago
Question
Answered: 1 week ago
Question
Answered: 1 week ago
Question
Answered: 1 week ago
Question
Answered: 1 week ago
View Answer in SolutionInn App


