Answered step by step
Verified Expert Solution
Question
1 Approved Answer
d.) What is Campbell's Cash Conversion Cycle for the most recent five years (2017 - 2021)? e.) What would you recommend if the company

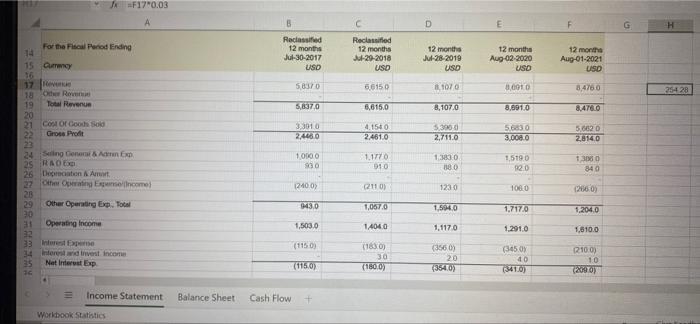
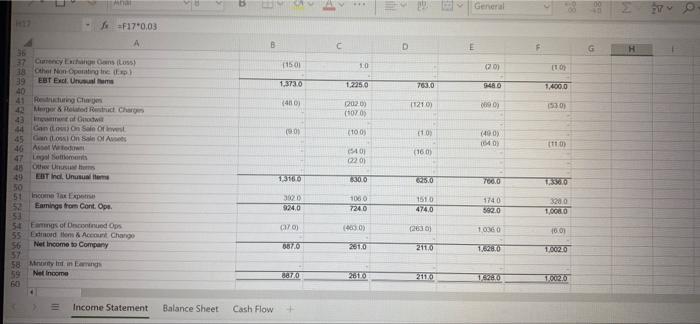
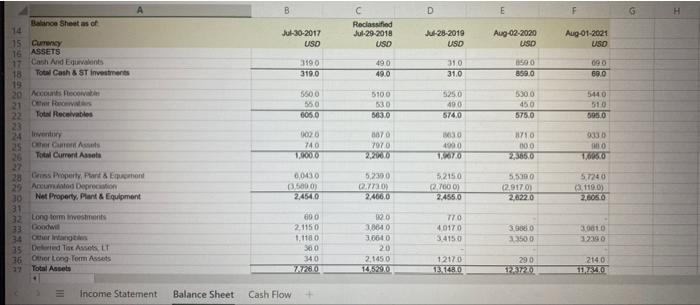
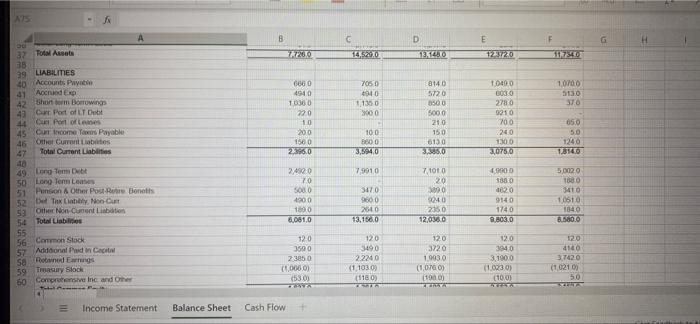
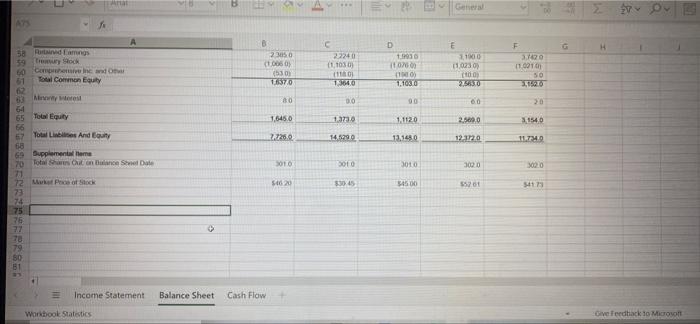
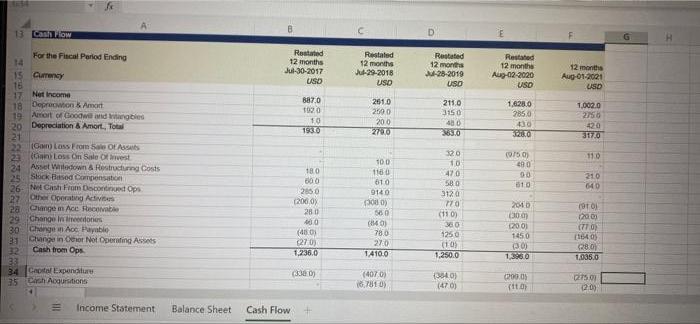
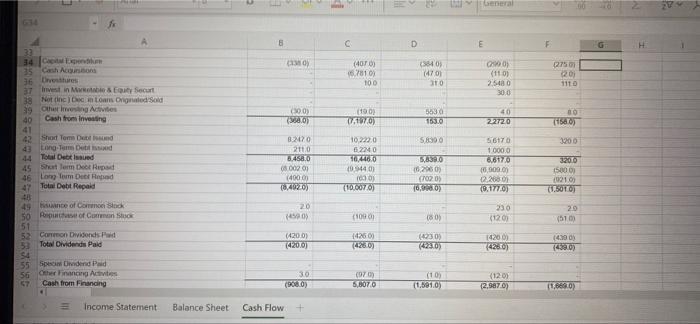
d.) What is Campbell's Cash Conversion Cycle for the most recent five years (2017 - 2021)? e.) What would you recommend if the company wanted to improve its Cash Conversion Cycle? JF17 0.03 A D. Reciassified 12 months Jul-30-2017 USD Reciassifed 12 months Ju-29-2018 For the Fiscal Period Ending 14 12 months Ju-28-2019 USD 12 months Aug-02-2020 USD 12 months Aug-01-2021 USD 15 Curmency 16 17 Reven 18 Oher Rover Total Revenue USD 5,8370 66150 8.1070 8,0010 8,4760 254 28 19 20 21 Cost Of Goods Sold Grose Profit 5,837.0 6,615.0 8,107.0 8,091.0 8,476.0 3,301.0 2,446.0 5.300 0 2,711.0 5,683.0 4.154 0 2,461.0 5,662 0 2814.0 22 23 24 Selling Generai & Adn Exp. 25 RADE 26 Doprecaton & Amort 27 Other Operatng Epemencome) 28 Other Operating Exp. Total 3,008.0 1,0000 1,1770 1.383.0 1.5190 1306 0 840 930 910 88.0 02.0 (240.0) (211 0) 123 0 (286.0) 106.0 29 30 Operating Income 32 33 Interest Expeme 34 nterest ard tnvest Income Net Intervst Exp 943.0 1,057.0 1,594.0 1,717.0 1,204.0 1,503.0 1,404.0 1,117.0 1,291.0 1,810.0 (115 0) (183 0) (356 0) (345.0 40 210.0) 30 20 10 35 (115.0) (180.0) (354.0) (341.0) 200 0 Income Statement Balance Sheet Cash Flow Workbook Statistics General ... F17 0.03 CTH D. G 36 37 Cunency Ehange Cans (Loss) 38 Cther Non Operating tne Exp) EBT Excl. Unuual ems (1501 10 (20) 39 40 41 Retuturing Chagen 42 Merper & Related Restruct Chargs gnnt of Godw 1.373.0 1225.0 763.0 1,400.0 948.0 (4 0) (121 0) (3.0) (107.0) 43 44 Gan Lm) On Sale Of invest Gan (1ossi On Sale Of Asets (9.0) (10 0) (1 0) (40 0) 45 46 Aset We teduw Legal Sottiomens (16 0) 40) 22 0) 47 48 Ote Unuue hems EBT ind. Unusual teme T3160 49 50 51 Income Ta Expetna Eamings trom Cont. Ope. 830.0 625.0 700.0 1.336.0 3020 106 0 724.0 1510 174 0 592.0 3280 52 553 54 Eamngs of Dncontrued Ops 55 Extrord Hom & Account Change Net Income to Company 924.0 474.0 1,008.0 (463 0) (263 0) 1,006 0 16.0) 56 687.0 261.0 211.0 1,628.0 1,002.0 57 58 Mnorty t in Eamngh Net Income 59 60 887.0 261.0 211.0 1,002.0 Income Statement Balance Sheet Cash Flow B D H. Balance Sheet as of 14 Reciassified Jul-29-2018 Ju-28-2019 USO Jul-30-2017 Aug-02-2020 USD Aug-01-2021 USO 15 Cumency 16 ASSETS 17 Cash And Equivalents Total Cash & ST investments USD USD 3190 49.0 310 859 0 090 319.0 18 19 520 Accounts ecovabl 21 Owr Reovas Total Receivables 49.0 31.0 859.0 60.0 5600 550 5100 530 525.0 5300 450 544.0 510 49 0 605.0 574.0 22 23 24 ventary 25 Oer Cment Assets Total Current Assets 563.0 575.0 595.0 0020 0070 630 8710 0330 7070 2,200.0 74.0 4900 1,000.0 1967.0 26 27 28 Grins Property, Pant & Equomont 29 Accumatod Deprecation Net Property, Plant &Equipment 2,385.0 1,606.0 6,043.0 0.500.0) 2,454.0 5,2300 5215.0 5,530 0 2.760 0) 2,455.0 (2.917.0) 2,622.0 5724 0 3119.0) 2,605.0 2,466.0 30 31 32 Long tom vestments 33 Goodw 34 Oer intangtes 15 Delerted Tiax Assets LT 36 Other Long Term Assets Total Assets 69 0 770 2.1150 3.864 0 3906 0 3.350 0 EX001.0 32300 40170 1.118.0 3.664.0 34150 36.0 20 340 2,145.0 1217.0 13.148.0 29 0 214.0 14,529.0 1140 27 Income Statement Balance Sheet Cash Flow A75 37 Total Aasets 7.720.0 14,529.0 13.146.0 123720 117340 39 LIABILITIES 40Accounts Payatie Accnaed Exp 666 0 705 0 1040.0 1.0700 5130 370 814 0 5720 603 0 278 0 921 0 700 41 Shon erm BoTowings 494 0 4940 1030 0 42 43 Ca Port of LT Debt Cun Port of Leanes 1,1350 3000 500.0 220 10 650 50 124 0 1.814.0 44 Cun tncome Tais Payable 21.0 150 200 10.0 45 46 Other Curent Liabites Total Cument Liablities 24.0 1300 3,076.0 150 0 6130 47 2396.0 3,594.0 3.35.0 40 49 Long Tem Debt 50 Long Tem Leames Penson & Other Post Rere Bonetts 2,420 7,1010 20 7.991,0 4,900 0 70 508 0 188 0 4820 5,002 0 188 0 3410 347.0 51 52 De Tx Lintity Non-Cur ca Ofter Non Cunent Liabaten $4 Total Liabilites 55 56 Conmon Stock 57 Adddonal Paid in Ceptal SA Rotaned Earnngs 59 Treasury Slock 60 Compretensive Inc and Oher 9600 0040 914 0 1740 4900 10610 1800 2640 235.0 184.0 6,081.0 13,156.0 12,036.0 8.803.0 8.500.0 120 120 4140 3,7420 (1.021 0) 50 120 120 12.0 3490 3720 1,903.0 359 0 3940 3,190.0 (1.023.0) (10.0) 2385 0 2.2240 (1,103.0) (118 0) (1,076 0) (100.0) (1.000 0) (53 0) !! Income Statement Balance Sheet Cash Flow General ... A75 H. a Rurtained Eamngs 59 Treury Sock 60 Cempteive ne and O Total Common Equity 22240 (1,103 0) 23050 (1.006 0 (530) 1.637.0 19930 3.7420 (1.0010) 1,023 0) 61 62 63 Mirvoty bterest 64 65 Total Equity 66 Yotal Liabies And Equity 1364.0 1,1030 2.563.0 3,1520 20 1,645.0 1.373.0 1.1120 2.509.0 3154.0 67 2260 14.5290 13.148.0 123720 11740 68 69 Bupplemental heme Total Sha Cut on Dulance Steet Date 70 71 72 Mket Proe of Stock 73 74 75 76 77 70 79. 80 81 3010 3010 302 0 302.0 S46 20 $30 45 $45.00 $5201 $41 73 Income Statement Balance Sheet Cash Flow Workbook Statistics Give Feedtiack to Microsoft Cash Plow For the Fiscal Period Ending 14 Restated 12 months Jul-30-2017 Restated 12 months Jul-29-2018 Restated 12 months J28-2019 Restated 12 months Aug-02-2020 USD 12 months Aug-01-2021 USD 15 Curency 16 17 Net Income 18 Deprecwon & Amort 19 Amort of Cloodwi and angbles 20 Depreciation & Amort. Total 21 22 (Gan) Loss From Sale Ot Assats 23 (Gani Loss On Sale Of vest 24 Asset Witedown a Restructurng Costs Stock Based Compensation USD USD USD 887.0 102.0 261.0 211.0 3150 1,628.0 285.0 430 328.0 1,002.0 2756 420 317.0 250 0 1.0 200 480 1930 270.0 363.0 32.0 (9/5 0) 480 110 100 10 18.0 1160 47.0 00 81.0 21.0 640 25 26: Net Cash From Decontinued Ops 27 Other Operating Adivites 28Oangem Ace Recovable 29 Change In neeedories 30 Change n Acc Payablo Change in Cher Not Operating Asets 610 58.0 265.0 (206.0) 280 9140 3120 201D (11 0) 360 1250 (10 1,250.0 (30 ) (20.0) (20.0) (77 0 (164.0) 28 0) 1.035.0 400 (40.0) (27.0) 1,236.0 78.0 270 145.0 31 Cash trom Ops. 32 33 34 Captal Expendlure 35 Csh Aoquisitions 1410.0 1,396.0 (407.0) (304. 0) (47 0) (200.0 (11.0) 6,781 0) 20) Income Statement Balance Sheet Cash Flow ueneral G34 D 33 34 Capta pndum 35 Cash Acquntons 36 venttures 37 Invest in Motabie& Equty Securt 38 Not tinc Dec nLonns. Orignaled Sold 39 Other Investng Ativites Cash from Inveing (384 0 (47 0) (407 0) o we) (275 01 20) 6.781 0) (11.0) 2548 0 30.0 100 1110 00 0) 8.0) 553 0 153.0 (19.0 40 2272.0 40 (1540) 41 Shot Tom Detl nd 42 Long-Term Detl d 82470 10,222 0 6224 0 16,446.0 (9.944.0) 5,839 0 56170 3200 43 Total Debt Isaued Short lem Debr Repad 211.0 6.458.0 8.002 01 (400 0 (8,402.0) 1000.0 44 5,839.0 (6,296 0) 6,617.0 (0,000.0) (2.268 0 (9.177.0) 3200 46 Total Debt Repaid 45 Long Tem Detr Repad (580 0) (021.00 (1.501.0) (702 0) 47 48 49 hance of Commoe ock 50 Repive of Comman Stack 51 52 Common Dividends Paid 33 Total Dividends Paid $4 55 Spec Cndend Paid 56 Cther Finanong Activites 57. (10.007.0) (6,0.0) 20 230 20 (459 0) (100 0) (60) (12.0) (51.0) (420.0) (426 0) (423 0) (423.0) (420 0) (428.0) (4300) (439.0) (420.0) (428.0) (970 5,807.0 30 (10) (1.591.0) (120) Cash from Financing (908.0) (2,987.0) (1,669.0) Income Statement Balance Sheet Cash Flow tuenera 4 Total Dete lnd Short Tam Ot rpat ASEO 16,446.0 4.617.0 45 46Lng lm Dt opad 47 Toal Debt Repaid (,002 0) (400 0 (6.402.0) V03 0) (10.007.0) 00.200.0) (702 0y 16.906.0 6.00 0) 2.268 0 210 (1501.0) 48 49 nce ot Common Sack 50 pnhae f Conmon loc 31 S Conon donds Pad Total Dividundu Pait 20 230 20 (4 0 (100 0) 120 (430 0) (430.0) (420.0) (426 0) (426.0) (423 0) (426 0 (420.0) (423 0) (426.0) 54 55 Speal Cvdend Paid 56 Ohe Finanong Activ Cash hrom Finsncing 30 (12.0) 2.987.0) 57 58 59 Formgn Exchange lale Aa (S06.0) 5,507.0 (1.591.0) (1.60.0) 11.0 (1.0) 6800 20 (790.0) 60 Net Change in Cash 12.0 61 62 63 65 66 67 Income Statement Balance Sheet Cash Flow Workbook Statistics Give Feedback to Microse d.) What is Campbell's Cash Conversion Cycle for the most recent five years (2017 - 2021)? e.) What would you recommend if the company wanted to improve its Cash Conversion Cycle? JF17 0.03 A D. Reciassified 12 months Jul-30-2017 USD Reciassifed 12 months Ju-29-2018 For the Fiscal Period Ending 14 12 months Ju-28-2019 USD 12 months Aug-02-2020 USD 12 months Aug-01-2021 USD 15 Curmency 16 17 Reven 18 Oher Rover Total Revenue USD 5,8370 66150 8.1070 8,0010 8,4760 254 28 19 20 21 Cost Of Goods Sold Grose Profit 5,837.0 6,615.0 8,107.0 8,091.0 8,476.0 3,301.0 2,446.0 5.300 0 2,711.0 5,683.0 4.154 0 2,461.0 5,662 0 2814.0 22 23 24 Selling Generai & Adn Exp. 25 RADE 26 Doprecaton & Amort 27 Other Operatng Epemencome) 28 Other Operating Exp. Total 3,008.0 1,0000 1,1770 1.383.0 1.5190 1306 0 840 930 910 88.0 02.0 (240.0) (211 0) 123 0 (286.0) 106.0 29 30 Operating Income 32 33 Interest Expeme 34 nterest ard tnvest Income Net Intervst Exp 943.0 1,057.0 1,594.0 1,717.0 1,204.0 1,503.0 1,404.0 1,117.0 1,291.0 1,810.0 (115 0) (183 0) (356 0) (345.0 40 210.0) 30 20 10 35 (115.0) (180.0) (354.0) (341.0) 200 0 Income Statement Balance Sheet Cash Flow Workbook Statistics General ... F17 0.03 CTH D. G 36 37 Cunency Ehange Cans (Loss) 38 Cther Non Operating tne Exp) EBT Excl. Unuual ems (1501 10 (20) 39 40 41 Retuturing Chagen 42 Merper & Related Restruct Chargs gnnt of Godw 1.373.0 1225.0 763.0 1,400.0 948.0 (4 0) (121 0) (3.0) (107.0) 43 44 Gan Lm) On Sale Of invest Gan (1ossi On Sale Of Asets (9.0) (10 0) (1 0) (40 0) 45 46 Aset We teduw Legal Sottiomens (16 0) 40) 22 0) 47 48 Ote Unuue hems EBT ind. Unusual teme T3160 49 50 51 Income Ta Expetna Eamings trom Cont. Ope. 830.0 625.0 700.0 1.336.0 3020 106 0 724.0 1510 174 0 592.0 3280 52 553 54 Eamngs of Dncontrued Ops 55 Extrord Hom & Account Change Net Income to Company 924.0 474.0 1,008.0 (463 0) (263 0) 1,006 0 16.0) 56 687.0 261.0 211.0 1,628.0 1,002.0 57 58 Mnorty t in Eamngh Net Income 59 60 887.0 261.0 211.0 1,002.0 Income Statement Balance Sheet Cash Flow B D H. Balance Sheet as of 14 Reciassified Jul-29-2018 Ju-28-2019 USO Jul-30-2017 Aug-02-2020 USD Aug-01-2021 USO 15 Cumency 16 ASSETS 17 Cash And Equivalents Total Cash & ST investments USD USD 3190 49.0 310 859 0 090 319.0 18 19 520 Accounts ecovabl 21 Owr Reovas Total Receivables 49.0 31.0 859.0 60.0 5600 550 5100 530 525.0 5300 450 544.0 510 49 0 605.0 574.0 22 23 24 ventary 25 Oer Cment Assets Total Current Assets 563.0 575.0 595.0 0020 0070 630 8710 0330 7070 2,200.0 74.0 4900 1,000.0 1967.0 26 27 28 Grins Property, Pant & Equomont 29 Accumatod Deprecation Net Property, Plant &Equipment 2,385.0 1,606.0 6,043.0 0.500.0) 2,454.0 5,2300 5215.0 5,530 0 2.760 0) 2,455.0 (2.917.0) 2,622.0 5724 0 3119.0) 2,605.0 2,466.0 30 31 32 Long tom vestments 33 Goodw 34 Oer intangtes 15 Delerted Tiax Assets LT 36 Other Long Term Assets Total Assets 69 0 770 2.1150 3.864 0 3906 0 3.350 0 EX001.0 32300 40170 1.118.0 3.664.0 34150 36.0 20 340 2,145.0 1217.0 13.148.0 29 0 214.0 14,529.0 1140 27 Income Statement Balance Sheet Cash Flow A75 37 Total Aasets 7.720.0 14,529.0 13.146.0 123720 117340 39 LIABILITIES 40Accounts Payatie Accnaed Exp 666 0 705 0 1040.0 1.0700 5130 370 814 0 5720 603 0 278 0 921 0 700 41 Shon erm BoTowings 494 0 4940 1030 0 42 43 Ca Port of LT Debt Cun Port of Leanes 1,1350 3000 500.0 220 10 650 50 124 0 1.814.0 44 Cun tncome Tais Payable 21.0 150 200 10.0 45 46 Other Curent Liabites Total Cument Liablities 24.0 1300 3,076.0 150 0 6130 47 2396.0 3,594.0 3.35.0 40 49 Long Tem Debt 50 Long Tem Leames Penson & Other Post Rere Bonetts 2,420 7,1010 20 7.991,0 4,900 0 70 508 0 188 0 4820 5,002 0 188 0 3410 347.0 51 52 De Tx Lintity Non-Cur ca Ofter Non Cunent Liabaten $4 Total Liabilites 55 56 Conmon Stock 57 Adddonal Paid in Ceptal SA Rotaned Earnngs 59 Treasury Slock 60 Compretensive Inc and Oher 9600 0040 914 0 1740 4900 10610 1800 2640 235.0 184.0 6,081.0 13,156.0 12,036.0 8.803.0 8.500.0 120 120 4140 3,7420 (1.021 0) 50 120 120 12.0 3490 3720 1,903.0 359 0 3940 3,190.0 (1.023.0) (10.0) 2385 0 2.2240 (1,103.0) (118 0) (1,076 0) (100.0) (1.000 0) (53 0) !! Income Statement Balance Sheet Cash Flow General ... A75 H. a Rurtained Eamngs 59 Treury Sock 60 Cempteive ne and O Total Common Equity 22240 (1,103 0) 23050 (1.006 0 (530) 1.637.0 19930 3.7420 (1.0010) 1,023 0) 61 62 63 Mirvoty bterest 64 65 Total Equity 66 Yotal Liabies And Equity 1364.0 1,1030 2.563.0 3,1520 20 1,645.0 1.373.0 1.1120 2.509.0 3154.0 67 2260 14.5290 13.148.0 123720 11740 68 69 Bupplemental heme Total Sha Cut on Dulance Steet Date 70 71 72 Mket Proe of Stock 73 74 75 76 77 70 79. 80 81 3010 3010 302 0 302.0 S46 20 $30 45 $45.00 $5201 $41 73 Income Statement Balance Sheet Cash Flow Workbook Statistics Give Feedtiack to Microsoft Cash Plow For the Fiscal Period Ending 14 Restated 12 months Jul-30-2017 Restated 12 months Jul-29-2018 Restated 12 months J28-2019 Restated 12 months Aug-02-2020 USD 12 months Aug-01-2021 USD 15 Curency 16 17 Net Income 18 Deprecwon & Amort 19 Amort of Cloodwi and angbles 20 Depreciation & Amort. Total 21 22 (Gan) Loss From Sale Ot Assats 23 (Gani Loss On Sale Of vest 24 Asset Witedown a Restructurng Costs Stock Based Compensation USD USD USD 887.0 102.0 261.0 211.0 3150 1,628.0 285.0 430 328.0 1,002.0 2756 420 317.0 250 0 1.0 200 480 1930 270.0 363.0 32.0 (9/5 0) 480 110 100 10 18.0 1160 47.0 00 81.0 21.0 640 25 26: Net Cash From Decontinued Ops 27 Other Operating Adivites 28Oangem Ace Recovable 29 Change In neeedories 30 Change n Acc Payablo Change in Cher Not Operating Asets 610 58.0 265.0 (206.0) 280 9140 3120 201D (11 0) 360 1250 (10 1,250.0 (30 ) (20.0) (20.0) (77 0 (164.0) 28 0) 1.035.0 400 (40.0) (27.0) 1,236.0 78.0 270 145.0 31 Cash trom Ops. 32 33 34 Captal Expendlure 35 Csh Aoquisitions 1410.0 1,396.0 (407.0) (304. 0) (47 0) (200.0 (11.0) 6,781 0) 20) Income Statement Balance Sheet Cash Flow ueneral G34 D 33 34 Capta pndum 35 Cash Acquntons 36 venttures 37 Invest in Motabie& Equty Securt 38 Not tinc Dec nLonns. Orignaled Sold 39 Other Investng Ativites Cash from Inveing (384 0 (47 0) (407 0) o we) (275 01 20) 6.781 0) (11.0) 2548 0 30.0 100 1110 00 0) 8.0) 553 0 153.0 (19.0 40 2272.0 40 (1540) 41 Shot Tom Detl nd 42 Long-Term Detl d 82470 10,222 0 6224 0 16,446.0 (9.944.0) 5,839 0 56170 3200 43 Total Debt Isaued Short lem Debr Repad 211.0 6.458.0 8.002 01 (400 0 (8,402.0) 1000.0 44 5,839.0 (6,296 0) 6,617.0 (0,000.0) (2.268 0 (9.177.0) 3200 46 Total Debt Repaid 45 Long Tem Detr Repad (580 0) (021.00 (1.501.0) (702 0) 47 48 49 hance of Commoe ock 50 Repive of Comman Stack 51 52 Common Dividends Paid 33 Total Dividends Paid $4 55 Spec Cndend Paid 56 Cther Finanong Activites 57. (10.007.0) (6,0.0) 20 230 20 (459 0) (100 0) (60) (12.0) (51.0) (420.0) (426 0) (423 0) (423.0) (420 0) (428.0) (4300) (439.0) (420.0) (428.0) (970 5,807.0 30 (10) (1.591.0) (120) Cash from Financing (908.0) (2,987.0) (1,669.0) Income Statement Balance Sheet Cash Flow tuenera 4 Total Dete lnd Short Tam Ot rpat ASEO 16,446.0 4.617.0 45 46Lng lm Dt opad 47 Toal Debt Repaid (,002 0) (400 0 (6.402.0) V03 0) (10.007.0) 00.200.0) (702 0y 16.906.0 6.00 0) 2.268 0 210 (1501.0) 48 49 nce ot Common Sack 50 pnhae f Conmon loc 31 S Conon donds Pad Total Dividundu Pait 20 230 20 (4 0 (100 0) 120 (430 0) (430.0) (420.0) (426 0) (426.0) (423 0) (426 0 (420.0) (423 0) (426.0) 54 55 Speal Cvdend Paid 56 Ohe Finanong Activ Cash hrom Finsncing 30 (12.0) 2.987.0) 57 58 59 Formgn Exchange lale Aa (S06.0) 5,507.0 (1.591.0) (1.60.0) 11.0 (1.0) 6800 20 (790.0) 60 Net Change in Cash 12.0 61 62 63 65 66 67 Income Statement Balance Sheet Cash Flow Workbook Statistics Give Feedback to Microse d.) What is Campbell's Cash Conversion Cycle for the most recent five years (2017 - 2021)? e.) What would you recommend if the company wanted to improve its Cash Conversion Cycle? JF17 0.03 A D. Reciassified 12 months Jul-30-2017 USD Reciassifed 12 months Ju-29-2018 For the Fiscal Period Ending 14 12 months Ju-28-2019 USD 12 months Aug-02-2020 USD 12 months Aug-01-2021 USD 15 Curmency 16 17 Reven 18 Oher Rover Total Revenue USD 5,8370 66150 8.1070 8,0010 8,4760 254 28 19 20 21 Cost Of Goods Sold Grose Profit 5,837.0 6,615.0 8,107.0 8,091.0 8,476.0 3,301.0 2,446.0 5.300 0 2,711.0 5,683.0 4.154 0 2,461.0 5,662 0 2814.0 22 23 24 Selling Generai & Adn Exp. 25 RADE 26 Doprecaton & Amort 27 Other Operatng Epemencome) 28 Other Operating Exp. Total 3,008.0 1,0000 1,1770 1.383.0 1.5190 1306 0 840 930 910 88.0 02.0 (240.0) (211 0) 123 0 (286.0) 106.0 29 30 Operating Income 32 33 Interest Expeme 34 nterest ard tnvest Income Net Intervst Exp 943.0 1,057.0 1,594.0 1,717.0 1,204.0 1,503.0 1,404.0 1,117.0 1,291.0 1,810.0 (115 0) (183 0) (356 0) (345.0 40 210.0) 30 20 10 35 (115.0) (180.0) (354.0) (341.0) 200 0 Income Statement Balance Sheet Cash Flow Workbook Statistics General ... F17 0.03 CTH D. G 36 37 Cunency Ehange Cans (Loss) 38 Cther Non Operating tne Exp) EBT Excl. Unuual ems (1501 10 (20) 39 40 41 Retuturing Chagen 42 Merper & Related Restruct Chargs gnnt of Godw 1.373.0 1225.0 763.0 1,400.0 948.0 (4 0) (121 0) (3.0) (107.0) 43 44 Gan Lm) On Sale Of invest Gan (1ossi On Sale Of Asets (9.0) (10 0) (1 0) (40 0) 45 46 Aset We teduw Legal Sottiomens (16 0) 40) 22 0) 47 48 Ote Unuue hems EBT ind. Unusual teme T3160 49 50 51 Income Ta Expetna Eamings trom Cont. Ope. 830.0 625.0 700.0 1.336.0 3020 106 0 724.0 1510 174 0 592.0 3280 52 553 54 Eamngs of Dncontrued Ops 55 Extrord Hom & Account Change Net Income to Company 924.0 474.0 1,008.0 (463 0) (263 0) 1,006 0 16.0) 56 687.0 261.0 211.0 1,628.0 1,002.0 57 58 Mnorty t in Eamngh Net Income 59 60 887.0 261.0 211.0 1,002.0 Income Statement Balance Sheet Cash Flow B D H. Balance Sheet as of 14 Reciassified Jul-29-2018 Ju-28-2019 USO Jul-30-2017 Aug-02-2020 USD Aug-01-2021 USO 15 Cumency 16 ASSETS 17 Cash And Equivalents Total Cash & ST investments USD USD 3190 49.0 310 859 0 090 319.0 18 19 520 Accounts ecovabl 21 Owr Reovas Total Receivables 49.0 31.0 859.0 60.0 5600 550 5100 530 525.0 5300 450 544.0 510 49 0 605.0 574.0 22 23 24 ventary 25 Oer Cment Assets Total Current Assets 563.0 575.0 595.0 0020 0070 630 8710 0330 7070 2,200.0 74.0 4900 1,000.0 1967.0 26 27 28 Grins Property, Pant & Equomont 29 Accumatod Deprecation Net Property, Plant &Equipment 2,385.0 1,606.0 6,043.0 0.500.0) 2,454.0 5,2300 5215.0 5,530 0 2.760 0) 2,455.0 (2.917.0) 2,622.0 5724 0 3119.0) 2,605.0 2,466.0 30 31 32 Long tom vestments 33 Goodw 34 Oer intangtes 15 Delerted Tiax Assets LT 36 Other Long Term Assets Total Assets 69 0 770 2.1150 3.864 0 3906 0 3.350 0 EX001.0 32300 40170 1.118.0 3.664.0 34150 36.0 20 340 2,145.0 1217.0 13.148.0 29 0 214.0 14,529.0 1140 27 Income Statement Balance Sheet Cash Flow A75 37 Total Aasets 7.720.0 14,529.0 13.146.0 123720 117340 39 LIABILITIES 40Accounts Payatie Accnaed Exp 666 0 705 0 1040.0 1.0700 5130 370 814 0 5720 603 0 278 0 921 0 700 41 Shon erm BoTowings 494 0 4940 1030 0 42 43 Ca Port of LT Debt Cun Port of Leanes 1,1350 3000 500.0 220 10 650 50 124 0 1.814.0 44 Cun tncome Tais Payable 21.0 150 200 10.0 45 46 Other Curent Liabites Total Cument Liablities 24.0 1300 3,076.0 150 0 6130 47 2396.0 3,594.0 3.35.0 40 49 Long Tem Debt 50 Long Tem Leames Penson & Other Post Rere Bonetts 2,420 7,1010 20 7.991,0 4,900 0 70 508 0 188 0 4820 5,002 0 188 0 3410 347.0 51 52 De Tx Lintity Non-Cur ca Ofter Non Cunent Liabaten $4 Total Liabilites 55 56 Conmon Stock 57 Adddonal Paid in Ceptal SA Rotaned Earnngs 59 Treasury Slock 60 Compretensive Inc and Oher 9600 0040 914 0 1740 4900 10610 1800 2640 235.0 184.0 6,081.0 13,156.0 12,036.0 8.803.0 8.500.0 120 120 4140 3,7420 (1.021 0) 50 120 120 12.0 3490 3720 1,903.0 359 0 3940 3,190.0 (1.023.0) (10.0) 2385 0 2.2240 (1,103.0) (118 0) (1,076 0) (100.0) (1.000 0) (53 0) !! Income Statement Balance Sheet Cash Flow General ... A75 H. a Rurtained Eamngs 59 Treury Sock 60 Cempteive ne and O Total Common Equity 22240 (1,103 0) 23050 (1.006 0 (530) 1.637.0 19930 3.7420 (1.0010) 1,023 0) 61 62 63 Mirvoty bterest 64 65 Total Equity 66 Yotal Liabies And Equity 1364.0 1,1030 2.563.0 3,1520 20 1,645.0 1.373.0 1.1120 2.509.0 3154.0 67 2260 14.5290 13.148.0 123720 11740 68 69 Bupplemental heme Total Sha Cut on Dulance Steet Date 70 71 72 Mket Proe of Stock 73 74 75 76 77 70 79. 80 81 3010 3010 302 0 302.0 S46 20 $30 45 $45.00 $5201 $41 73 Income Statement Balance Sheet Cash Flow Workbook Statistics Give Feedtiack to Microsoft Cash Plow For the Fiscal Period Ending 14 Restated 12 months Jul-30-2017 Restated 12 months Jul-29-2018 Restated 12 months J28-2019 Restated 12 months Aug-02-2020 USD 12 months Aug-01-2021 USD 15 Curency 16 17 Net Income 18 Deprecwon & Amort 19 Amort of Cloodwi and angbles 20 Depreciation & Amort. Total 21 22 (Gan) Loss From Sale Ot Assats 23 (Gani Loss On Sale Of vest 24 Asset Witedown a Restructurng Costs Stock Based Compensation USD USD USD 887.0 102.0 261.0 211.0 3150 1,628.0 285.0 430 328.0 1,002.0 2756 420 317.0 250 0 1.0 200 480 1930 270.0 363.0 32.0 (9/5 0) 480 110 100 10 18.0 1160 47.0 00 81.0 21.0 640 25 26: Net Cash From Decontinued Ops 27 Other Operating Adivites 28Oangem Ace Recovable 29 Change In neeedories 30 Change n Acc Payablo Change in Cher Not Operating Asets 610 58.0 265.0 (206.0) 280 9140 3120 201D (11 0) 360 1250 (10 1,250.0 (30 ) (20.0) (20.0) (77 0 (164.0) 28 0) 1.035.0 400 (40.0) (27.0) 1,236.0 78.0 270 145.0 31 Cash trom Ops. 32 33 34 Captal Expendlure 35 Csh Aoquisitions 1410.0 1,396.0 (407.0) (304. 0) (47 0) (200.0 (11.0) 6,781 0) 20) Income Statement Balance Sheet Cash Flow ueneral G34 D 33 34 Capta pndum 35 Cash Acquntons 36 venttures 37 Invest in Motabie& Equty Securt 38 Not tinc Dec nLonns. Orignaled Sold 39 Other Investng Ativites Cash from Inveing (384 0 (47 0) (407 0) o we) (275 01 20) 6.781 0) (11.0) 2548 0 30.0 100 1110 00 0) 8.0) 553 0 153.0 (19.0 40 2272.0 40 (1540) 41 Shot Tom Detl nd 42 Long-Term Detl d 82470 10,222 0 6224 0 16,446.0 (9.944.0) 5,839 0 56170 3200 43 Total Debt Isaued Short lem Debr Repad 211.0 6.458.0 8.002 01 (400 0 (8,402.0) 1000.0 44 5,839.0 (6,296 0) 6,617.0 (0,000.0) (2.268 0 (9.177.0) 3200 46 Total Debt Repaid 45 Long Tem Detr Repad (580 0) (021.00 (1.501.0) (702 0) 47 48 49 hance of Commoe ock 50 Repive of Comman Stack 51 52 Common Dividends Paid 33 Total Dividends Paid $4 55 Spec Cndend Paid 56 Cther Finanong Activites 57. (10.007.0) (6,0.0) 20 230 20 (459 0) (100 0) (60) (12.0) (51.0) (420.0) (426 0) (423 0) (423.0) (420 0) (428.0) (4300) (439.0) (420.0) (428.0) (970 5,807.0 30 (10) (1.591.0) (120) Cash from Financing (908.0) (2,987.0) (1,669.0) Income Statement Balance Sheet Cash Flow tuenera 4 Total Dete lnd Short Tam Ot rpat ASEO 16,446.0 4.617.0 45 46Lng lm Dt opad 47 Toal Debt Repaid (,002 0) (400 0 (6.402.0) V03 0) (10.007.0) 00.200.0) (702 0y 16.906.0 6.00 0) 2.268 0 210 (1501.0) 48 49 nce ot Common Sack 50 pnhae f Conmon loc 31 S Conon donds Pad Total Dividundu Pait 20 230 20 (4 0 (100 0) 120 (430 0) (430.0) (420.0) (426 0) (426.0) (423 0) (426 0 (420.0) (423 0) (426.0) 54 55 Speal Cvdend Paid 56 Ohe Finanong Activ Cash hrom Finsncing 30 (12.0) 2.987.0) 57 58 59 Formgn Exchange lale Aa (S06.0) 5,507.0 (1.591.0) (1.60.0) 11.0 (1.0) 6800 20 (790.0) 60 Net Change in Cash 12.0 61 62 63 65 66 67 Income Statement Balance Sheet Cash Flow Workbook Statistics Give Feedback to Microse d.) What is Campbell's Cash Conversion Cycle for the most recent five years (2017 - 2021)? e.) What would you recommend if the company wanted to improve its Cash Conversion Cycle? JF17 0.03 A D. Reciassified 12 months Jul-30-2017 USD Reciassifed 12 months Ju-29-2018 For the Fiscal Period Ending 14 12 months Ju-28-2019 USD 12 months Aug-02-2020 USD 12 months Aug-01-2021 USD 15 Curmency 16 17 Reven 18 Oher Rover Total Revenue USD 5,8370 66150 8.1070 8,0010 8,4760 254 28 19 20 21 Cost Of Goods Sold Grose Profit 5,837.0 6,615.0 8,107.0 8,091.0 8,476.0 3,301.0 2,446.0 5.300 0 2,711.0 5,683.0 4.154 0 2,461.0 5,662 0 2814.0 22 23 24 Selling Generai & Adn Exp. 25 RADE 26 Doprecaton & Amort 27 Other Operatng Epemencome) 28 Other Operating Exp. Total 3,008.0 1,0000 1,1770 1.383.0 1.5190 1306 0 840 930 910 88.0 02.0 (240.0) (211 0) 123 0 (286.0) 106.0 29 30 Operating Income 32 33 Interest Expeme 34 nterest ard tnvest Income Net Intervst Exp 943.0 1,057.0 1,594.0 1,717.0 1,204.0 1,503.0 1,404.0 1,117.0 1,291.0 1,810.0 (115 0) (183 0) (356 0) (345.0 40 210.0) 30 20 10 35 (115.0) (180.0) (354.0) (341.0) 200 0 Income Statement Balance Sheet Cash Flow Workbook Statistics General ... F17 0.03 CTH D. G 36 37 Cunency Ehange Cans (Loss) 38 Cther Non Operating tne Exp) EBT Excl. Unuual ems (1501 10 (20) 39 40 41 Retuturing Chagen 42 Merper & Related Restruct Chargs gnnt of Godw 1.373.0 1225.0 763.0 1,400.0 948.0 (4 0) (121 0) (3.0) (107.0) 43 44 Gan Lm) On Sale Of invest Gan (1ossi On Sale Of Asets (9.0) (10 0) (1 0) (40 0) 45 46 Aset We teduw Legal Sottiomens (16 0) 40) 22 0) 47 48 Ote Unuue hems EBT ind. Unusual teme T3160 49 50 51 Income Ta Expetna Eamings trom Cont. Ope. 830.0 625.0 700.0 1.336.0 3020 106 0 724.0 1510 174 0 592.0 3280 52 553 54 Eamngs of Dncontrued Ops 55 Extrord Hom & Account Change Net Income to Company 924.0 474.0 1,008.0 (463 0) (263 0) 1,006 0 16.0) 56 687.0 261.0 211.0 1,628.0 1,002.0 57 58 Mnorty t in Eamngh Net Income 59 60 887.0 261.0 211.0 1,002.0 Income Statement Balance Sheet Cash Flow B D H. Balance Sheet as of 14 Reciassified Jul-29-2018 Ju-28-2019 USO Jul-30-2017 Aug-02-2020 USD Aug-01-2021 USO 15 Cumency 16 ASSETS 17 Cash And Equivalents Total Cash & ST investments USD USD 3190 49.0 310 859 0 090 319.0 18 19 520 Accounts ecovabl 21 Owr Reovas Total Receivables 49.0 31.0 859.0 60.0 5600 550 5100 530 525.0 5300 450 544.0 510 49 0 605.0 574.0 22 23 24 ventary 25 Oer Cment Assets Total Current Assets 563.0 575.0 595.0 0020 0070 630 8710 0330 7070 2,200.0 74.0 4900 1,000.0 1967.0 26 27 28 Grins Property, Pant & Equomont 29 Accumatod Deprecation Net Property, Plant &Equipment 2,385.0 1,606.0 6,043.0 0.500.0) 2,454.0 5,2300 5215.0 5,530 0 2.760 0) 2,455.0 (2.917.0) 2,622.0 5724 0 3119.0) 2,605.0 2,466.0 30 31 32 Long tom vestments 33 Goodw 34 Oer intangtes 15 Delerted Tiax Assets LT 36 Other Long Term Assets Total Assets 69 0 770 2.1150 3.864 0 3906 0 3.350 0 EX001.0 32300 40170 1.118.0 3.664.0 34150 36.0 20 340 2,145.0 1217.0 13.148.0 29 0 214.0 14,529.0 1140 27 Income Statement Balance Sheet Cash Flow A75 37 Total Aasets 7.720.0 14,529.0 13.146.0 123720 117340 39 LIABILITIES 40Accounts Payatie Accnaed Exp 666 0 705 0 1040.0 1.0700 5130 370 814 0 5720 603 0 278 0 921 0 700 41 Shon erm BoTowings 494 0 4940 1030 0 42 43 Ca Port of LT Debt Cun Port of Leanes 1,1350 3000 500.0 220 10 650 50 124 0 1.814.0 44 Cun tncome Tais Payable 21.0 150 200 10.0 45 46 Other Curent Liabites Total Cument Liablities 24.0 1300 3,076.0 150 0 6130 47 2396.0 3,594.0 3.35.0 40 49 Long Tem Debt 50 Long Tem Leames Penson & Other Post Rere Bonetts 2,420 7,1010 20 7.991,0 4,900 0 70 508 0 188 0 4820 5,002 0 188 0 3410 347.0 51 52 De Tx Lintity Non-Cur ca Ofter Non Cunent Liabaten $4 Total Liabilites 55 56 Conmon Stock 57 Adddonal Paid in Ceptal SA Rotaned Earnngs 59 Treasury Slock 60 Compretensive Inc and Oher 9600 0040 914 0 1740 4900 10610 1800 2640 235.0 184.0 6,081.0 13,156.0 12,036.0 8.803.0 8.500.0 120 120 4140 3,7420 (1.021 0) 50 120 120 12.0 3490 3720 1,903.0 359 0 3940 3,190.0 (1.023.0) (10.0) 2385 0 2.2240 (1,103.0) (118 0) (1,076 0) (100.0) (1.000 0) (53 0) !! Income Statement Balance Sheet Cash Flow General ... A75 H. a Rurtained Eamngs 59 Treury Sock 60 Cempteive ne and O Total Common Equity 22240 (1,103 0) 23050 (1.006 0 (530) 1.637.0 19930 3.7420 (1.0010) 1,023 0) 61 62 63 Mirvoty bterest 64 65 Total Equity 66 Yotal Liabies And Equity 1364.0 1,1030 2.563.0 3,1520 20 1,645.0 1.373.0 1.1120 2.509.0 3154.0 67 2260 14.5290 13.148.0 123720 11740 68 69 Bupplemental heme Total Sha Cut on Dulance Steet Date 70 71 72 Mket Proe of Stock 73 74 75 76 77 70 79. 80 81 3010 3010 302 0 302.0 S46 20 $30 45 $45.00 $5201 $41 73 Income Statement Balance Sheet Cash Flow Workbook Statistics Give Feedtiack to Microsoft Cash Plow For the Fiscal Period Ending 14 Restated 12 months Jul-30-2017 Restated 12 months Jul-29-2018 Restated 12 months J28-2019 Restated 12 months Aug-02-2020 USD 12 months Aug-01-2021 USD 15 Curency 16 17 Net Income 18 Deprecwon & Amort 19 Amort of Cloodwi and angbles 20 Depreciation & Amort. Total 21 22 (Gan) Loss From Sale Ot Assats 23 (Gani Loss On Sale Of vest 24 Asset Witedown a Restructurng Costs Stock Based Compensation USD USD USD 887.0 102.0 261.0 211.0 3150 1,628.0 285.0 430 328.0 1,002.0 2756 420 317.0 250 0 1.0 200 480 1930 270.0 363.0 32.0 (9/5 0) 480 110 100 10 18.0 1160 47.0 00 81.0 21.0 640 25 26: Net Cash From Decontinued Ops 27 Other Operating Adivites 28Oangem Ace Recovable 29 Change In neeedories 30 Change n Acc Payablo Change in Cher Not Operating Asets 610 58.0 265.0 (206.0) 280 9140 3120 201D (11 0) 360 1250 (10 1,250.0 (30 ) (20.0) (20.0) (77 0 (164.0) 28 0) 1.035.0 400 (40.0) (27.0) 1,236.0 78.0 270 145.0 31 Cash trom Ops. 32 33 34 Captal Expendlure 35 Csh Aoquisitions 1410.0 1,396.0 (407.0) (304. 0) (47 0) (200.0 (11.0) 6,781 0) 20) Income Statement Balance Sheet Cash Flow ueneral G34 D 33 34 Capta pndum 35 Cash Acquntons 36 venttures 37 Invest in Motabie& Equty Securt 38 Not tinc Dec nLonns. Orignaled Sold 39 Other Investng Ativites Cash from Inveing (384 0 (47 0) (407 0) o we) (275 01 20) 6.781 0) (11.0) 2548 0 30.0 100 1110 00 0) 8.0) 553 0 153.0 (19.0 40 2272.0 40 (1540) 41 Shot Tom Detl nd 42 Long-Term Detl d 82470 10,222 0 6224 0 16,446.0 (9.944.0) 5,839 0 56170 3200 43 Total Debt Isaued Short lem Debr Repad 211.0 6.458.0 8.002 01 (400 0 (8,402.0) 1000.0 44 5,839.0 (6,296 0) 6,617.0 (0,000.0) (2.268 0 (9.177.0) 3200 46 Total Debt Repaid 45 Long Tem Detr Repad (580 0) (021.00 (1.501.0) (702 0) 47 48 49 hance of Commoe ock 50 Repive of Comman Stack 51 52 Common Dividends Paid 33 Total Dividends Paid $4 55 Spec Cndend Paid 56 Cther Finanong Activites 57. (10.007.0) (6,0.0) 20 230 20 (459 0) (100 0) (60) (12.0) (51.0) (420.0) (426 0) (423 0) (423.0) (420 0) (428.0) (4300) (439.0) (420.0) (428.0) (970 5,807.0 30 (10) (1.591.0) (120) Cash from Financing (908.0) (2,987.0) (1,669.0) Income Statement Balance Sheet Cash Flow tuenera 4 Total Dete lnd Short Tam Ot rpat ASEO 16,446.0 4.617.0 45 46Lng lm Dt opad 47 Toal Debt Repaid (,002 0) (400 0 (6.402.0) V03 0) (10.007.0) 00.200.0) (702 0y 16.906.0 6.00 0) 2.268 0 210 (1501.0) 48 49 nce ot Common Sack 50 pnhae f Conmon loc 31 S Conon donds Pad Total Dividundu Pait 20 230 20 (4 0 (100 0) 120 (430 0) (430.0) (420.0) (426 0) (426.0) (423 0) (426 0 (420.0) (423 0) (426.0) 54 55 Speal Cvdend Paid 56 Ohe Finanong Activ Cash hrom Finsncing 30 (12.0) 2.987.0) 57 58 59 Formgn Exchange lale Aa (S06.0) 5,507.0 (1.591.0) (1.60.0) 11.0 (1.0) 6800 20 (790.0) 60 Net Change in Cash 12.0 61 62 63 65 66 67 Income Statement Balance Sheet Cash Flow Workbook Statistics Give Feedback to Microse
Step by Step Solution
★★★★★
3.48 Rating (164 Votes )
There are 3 Steps involved in it
Step: 1
Suggestions To improve the cash conversation cycle Improved Cash conversion cycle means ...
Get Instant Access to Expert-Tailored Solutions
See step-by-step solutions with expert insights and AI powered tools for academic success
Step: 2

Step: 3

Ace Your Homework with AI
Get the answers you need in no time with our AI-driven, step-by-step assistance
Get Started


