

Answered step by step
Verified Expert Solution
Question
1 Approved Answer
DATA: 14.5. Assume that the first three data points (including the value of Pal) of Table 12.1, p. 431, cannot be measured. Nevertheless, a correlation
DATA:
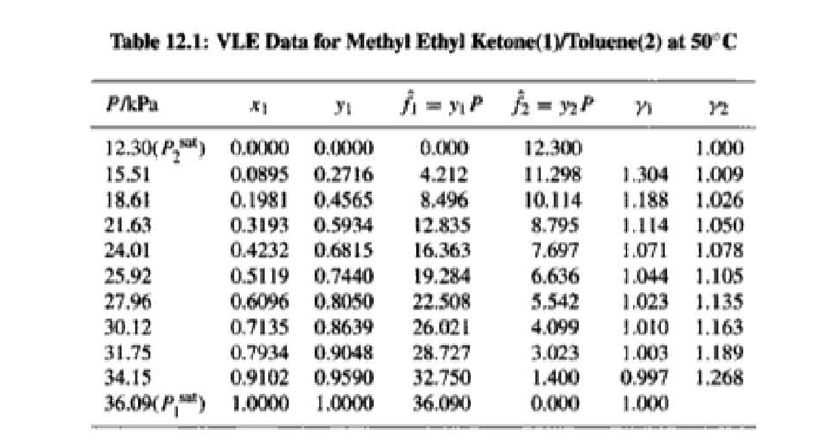
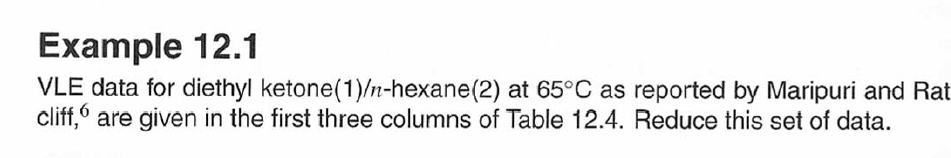
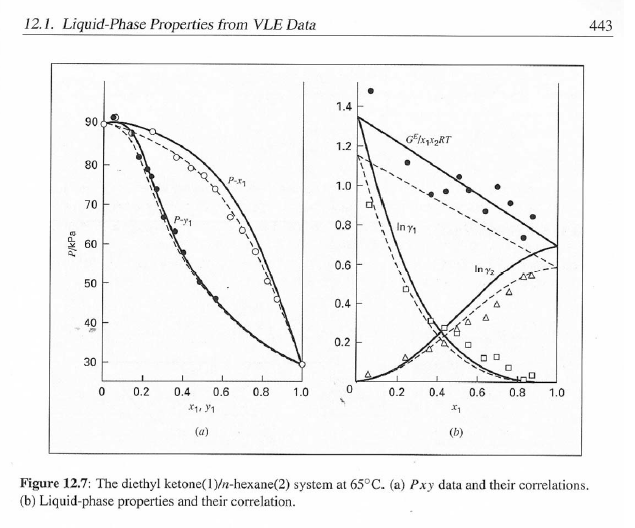
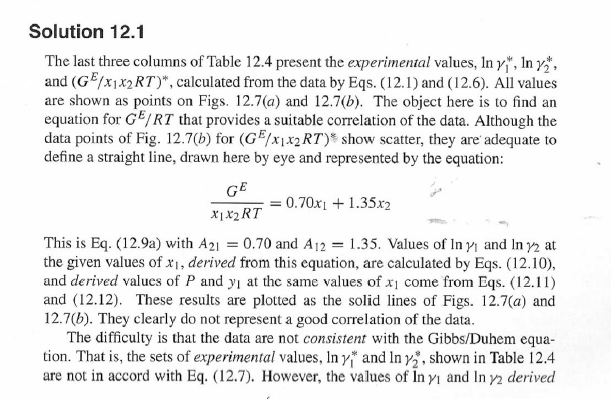
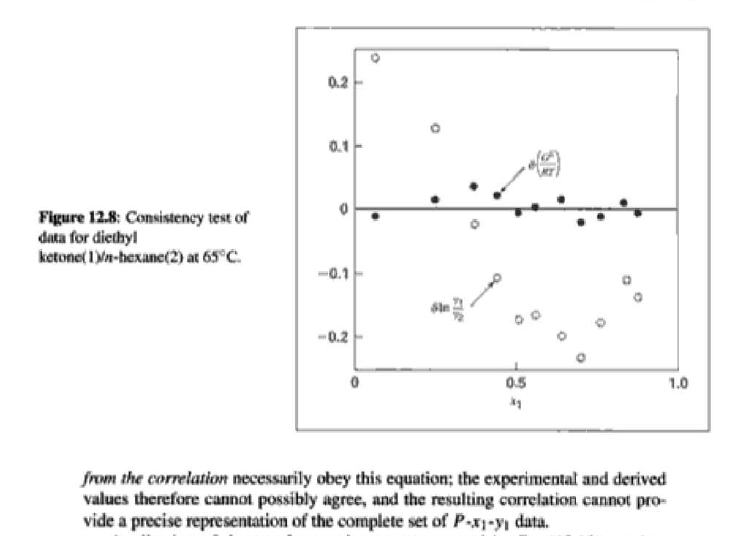
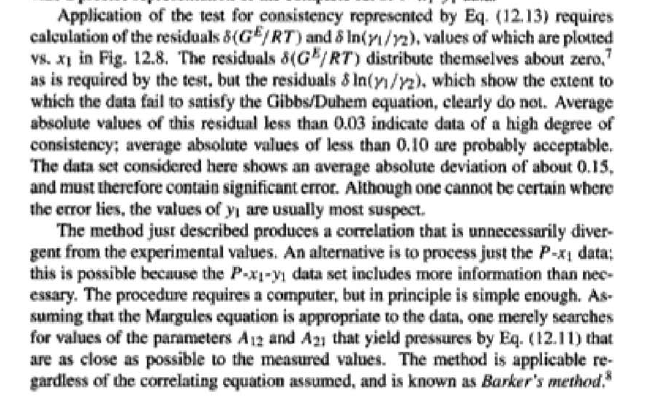
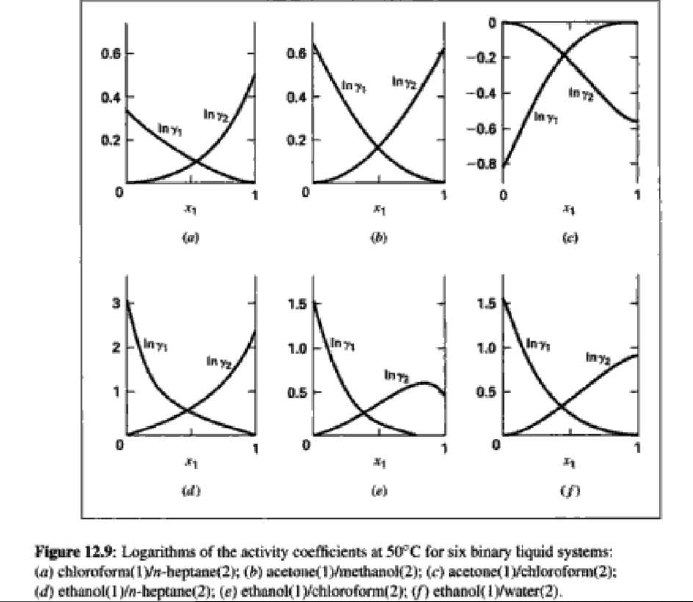
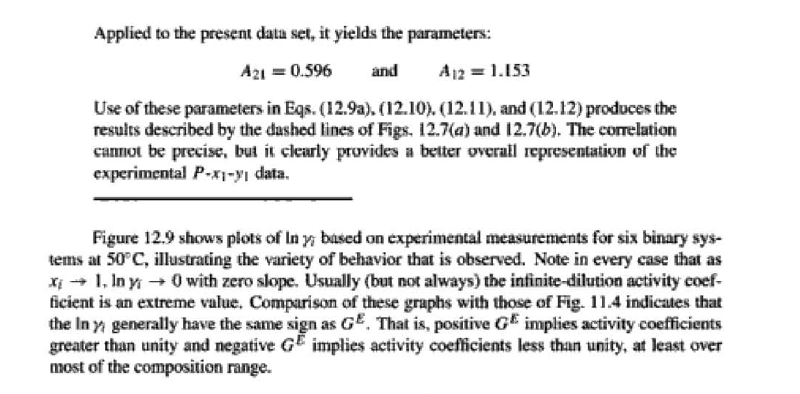
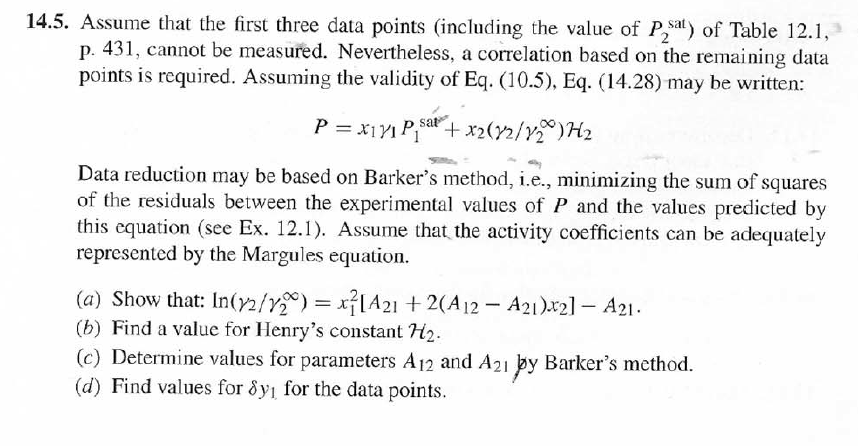
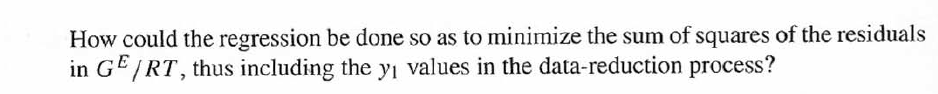
14.5. Assume that the first three data points (including the value of Pal) of Table 12.1, p. 431, cannot be measured. Nevertheless, a correlation based on the remaining data points is required. Assuming the validity of Eq. (10.5), Eq. (14.28) may be written: P = x171 P. sal + x2(72/720)H2 xiyP Data reduction may be based on Barker's method, i.e., minimizing the sum of squares of the residuals between the experimental values of P and the values predicted by this equation (see Ex. 12.1). Assume that the activity coefficients can be adequately represented by the Margules equation. (a) Show that: In(72/YX) = x[A21 + 2(A12 A21 )x2] A21- (6) Find a value for Henry's constant H2. c) Determine values for parameters A12 and A21 by Barker's method. (d) Find values for Sy, for the data points. How could the regression be done so as to minimize the sum of squares of the residuals in G /RT, thus including the y values in the data-reduction process? Table 12.1: VLE Data for Methyl Ethyl Ketone(1)Toluene(2) at 50 C PP #1 12.30 , ) . . ) 15.51 0.0895 0.2716 18.61 0.1981 0.4565 21.63 0.3193 0.5934 24.01 0.4232 0.6815 25.92 0.5119 0.7440 27.96 0.6096 0,8050 30.12 0.7135 0.8639 31.75 0.7934 0.9048 34.15 0.9102 0.9590 36.09P, S) 1.000 1.0000 = y P = y2P = yP 12 0.000 12.300 1.000 4.212 11.298 1.304 1.009 8.496 10.114 1.188 1.026 12.835 8.795 1.114 1.050 16.363 7.697 1.071 1.078 19.284 6.636 1.044 1.105 22.508 5,542 1.023 1.135 26.021 4.099 1.010 1.163 28.727 3.023 1.003 1.189 32.750 1.400 0.997 1.268 36.00) 0.000 1.000 Example 12.1 VLE data for diethyl ketone(1)-hexane(2) at 65C as reported by Maripuri and Rat Cliff,' are given in the first three columns of Table 12.4. Reduce this set of data. 6 12.1. Liquid-Phase Properties from VLE Data 443 1.4 90 1.2 GE/X9X9RT 80 - P-1 1.0 70 - P-41 ---0-0- 0.8 in 1 P/kPa 60 - 0.6 In 2 50 0.4 40 0.2 30 0 0 1 0.2 1 0.4 0.6 X 1.1 0.8 1.0 0 0.2 0.6 0.8 1.0 0.4 ti (a) (b) Figure 12.7: The diethyl ketone(1)n-hexane(2) system at 65C. (a) Pxy data and their correlations. (b) Liquid-phase properties and their correlation. Solution 12.1 The last three columns of Table 12.4 present the experimental values, In y", In y", and (GF/x1x2 RT)*, calculated from the data by Eqs. (12.1) and (12.6). All values are shown as points on Figs. 12.7(a) and 12.7(b). The object here is to find an equation for G/RT that provides a suitable correlation of the data. Although the data points of Fig. 12.7(b) for (GF/X1x2 RT) show scatter, they are adequate to define a straight line, drawn here by eye and represented by the equation: GE = 0.70x1 + 1.35x2 X1 X2 RT This is Eq. (12.9a) with A21 = 0.70 and A12 = 1.35. Values of In 1 and In 72 at the given values of x1, derived from this equation, are calculated by Eqs. (12.10), and derived values of P and y, at the same values of x1 come from Eqs. (12.11) and (12.12). These results are plotted as the solid lines of Figs. 12.7(a) and 12.7(b). They clearly do not represent a good correlation of the data. The difficulty is that the data are not consistent with the Gibbs/Duhem equa- tion. That is, the sets of experimental values, In yand In 72, shown in Table 12.4 are not in accord with Eq. (12.7). However, the values of In Yi and In 72 derived 0.2 0.1 - 0 Figure 12.8: Consistency test of data for diethyl ketone In-hexane(2) at 65C. -0.1 sin -0.2 0.5 1.0 from the correlation necessarily obey this equation; the experimental and derived values therefore cannot possibly agree, and the resulting correlation cannot pro- vide a precise representation of the complete set of P-11-21 data. Application of the test for consistency represented by Eq. (12.13) requires calculation of the residuals 8(GE/RT) and 8 In(r), values of which are plotted VS. XI in Fig. 12.8. The residuals 8(G/RT) distribute themselves about zero, as is required by the test, but the residuals 8 Inin/y2), which show the extent to which the data fail to satisfy the Gibbs/Duhem equation, clearly do not. Average absolute values of this residual less than 0.03 indicate data of a high degree of consistency; average absolute values of less than 0.10 are probably acceptable. The data set considered here shows an average absolute deviation of about 0.15, and must therefore contain significant error. Although one cannot be certain where the error lies, the values of y, are usually most suspect. The method just described produces a correlation that is unnecessarily diver- gent from the experimental values. An alternative is to process just the P-X data: this is possible because the P-X1-1 data set includes more information than nee- essary. The procedure requires a computer, but in principle is simple enough. As- suming that the Margules equation is appropriate to the data, one merely searches for values of the parameters A12 and A2 that yield pressures by Eq. (12.11) that are as close as possible to the measured values. The method is applicable re- gardless of the correlating equation assumed, and is known as Barker's method. 06 0.6 -0.2 ( P# in 0.4 0.4 -0.4 s in , -0.6 0.2 0.2 -0.8 0 0 fel 4 1.5 1.5 N 2 {\mys 10 HKD 1.0 { Inn D 1 0.5 0.5 f Figure 12.9: Logarithms of the activity coefficients at 50C for six bnary tiquid systems: (a) chloroforma In-heptanet2): () acetone(1)Amethanol(2): (c) acetoned chloroform(2): (d) ethanol( 1 )n-heptane(2): (e) ethanok(IVchloroform(2): ethanol 1 water(2). Applied to the present data set, it yields the parameters: A2 = 0.596 and A12 = 1.153 Use of these parameters in Eqs. (12.9a). (12.10). (12.11), and (12.12) produces the results described by the dushed lines of Figs. 12.7(a) and 12.7(b). The correlation cannot be precise, but it clearly provides a beiter overall representation of the experimental P-21-y data. Figure 12.9 shows plots of In based on experimental measurements for six binary sys- tems at 50C, illustrating the variety of behavior that is observed. Note in every case that as Xi 1, In Yi + 0 with zero slope. Usually (but not always) the infinite-dilution activity coef- ficient is an extreme value. Comparison of these graphs with those of Fig. 11.4 indicates that the In y generally have the same sign as G. That is, positive implies activity coefficients greater than unity and negative implies activity coefficients less than unity, at least over most of the composition range
Step by Step Solution
There are 3 Steps involved in it
Step: 1

Get Instant Access to Expert-Tailored Solutions
See step-by-step solutions with expert insights and AI powered tools for academic success
Step: 2

Step: 3
Ace Your Homework with AI
Get the answers you need in no time with our AI-driven, step-by-step assistance
Get Started
Heat And Mass Transfer Fundamentals And Applications
Authors: Yunus Cengel, Afshin Ghajar
5th Edition
0073398187, 978-0073398181