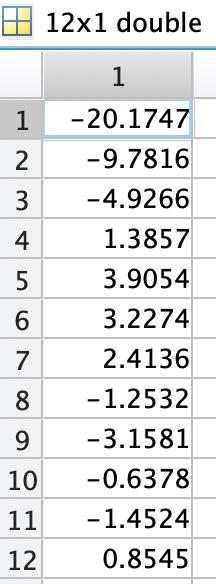
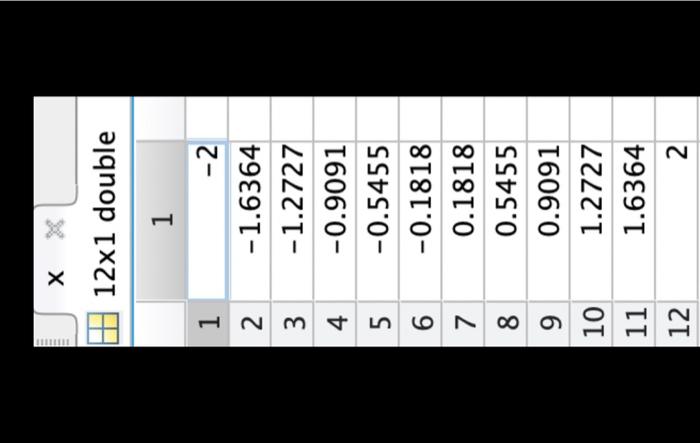
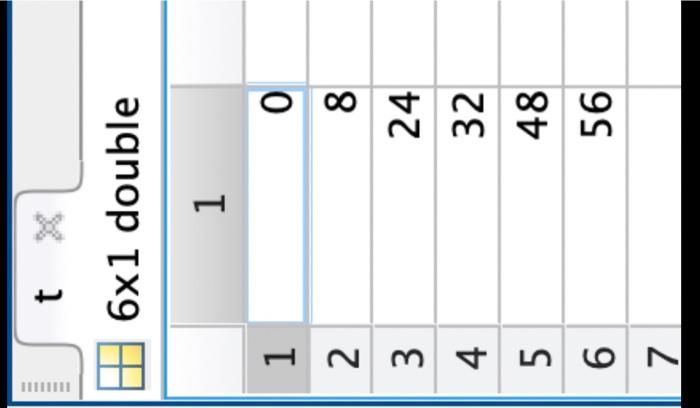
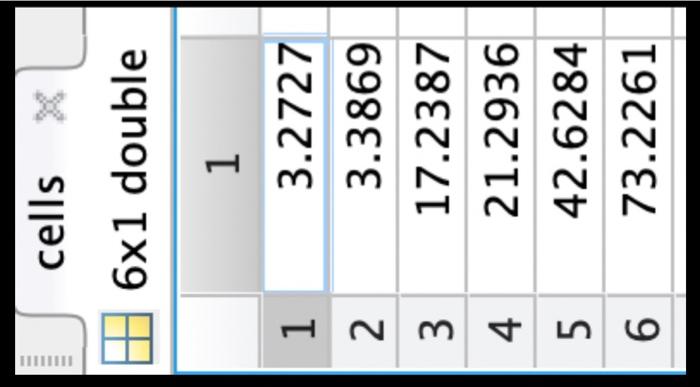
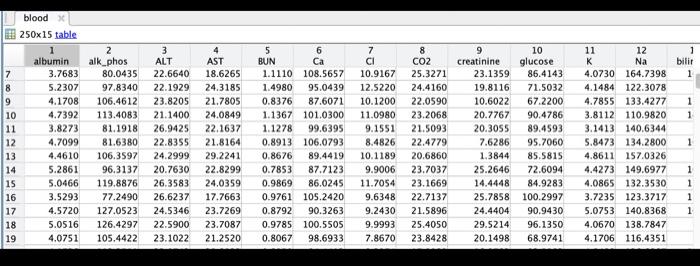
data above is provided ans asked to load before working on the question
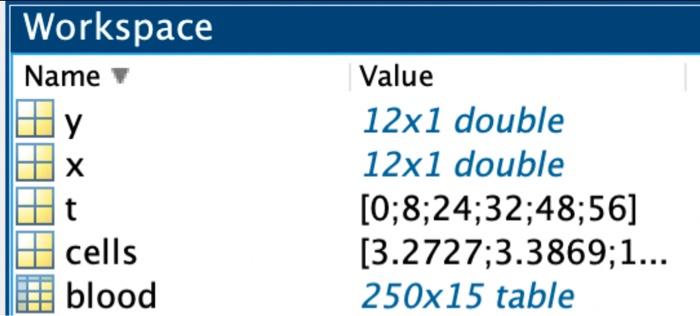
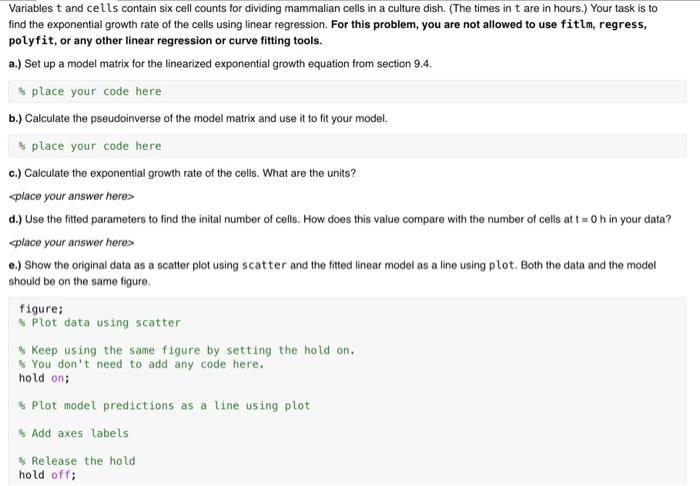
121 double \begin{tabular}{|c|r|} \hline & \multicolumn{1}{|c|}{1} \\ \hline 1 & 20.1747 \\ \hline 2 & 9.7816 \\ \hline 3 & 4.9266 \\ \hline 4 & 1.3857 \\ \hline 5 & 3.9054 \\ \hline 6 & 3.2274 \\ \hline 7 & 2.4136 \\ \hline 8 & 1.2532 \\ \hline 9 & 3.1581 \\ \hline 10 & 0.6378 \\ \hline 11 & 1.4524 \\ \hline 12 & 0.8545 \\ \hline \end{tabular} 121 double \begin{tabular}{|c|r|} \hline & \multicolumn{1}{|c|}{1} \\ \hline 1 & 2 \\ \hline 2 & 1.6364 \\ \hline 3 & 1.2727 \\ \hline 4 & 0.9091 \\ \hline 5 & 0.5455 \\ \hline 6 & 0.1818 \\ \hline 7 & 0.1818 \\ \hline 8 & 0.5455 \\ \hline 9 & 0.9091 \\ \hline 10 & 1.2727 \\ \hline 11 & 1.6364 \\ \hline 12 & 2 \\ \hline \end{tabular} 61 double \begin{tabular}{|r|r|} \hline & 1 \\ \hline 1 & 0 \\ \hline 2 & 8 \\ \hline 3 & 24 \\ \hline 4 & 32 \\ \hline 5 & 48 \\ \hline 6 & 56 \\ \hline 7 & \\ \hline \end{tabular} cells 61 double \begin{tabular}{|l|r|} \hline & \multicolumn{1}{|c|}{1} \\ \hline 1 & 3.2727 \\ \hline 2 & 3.3869 \\ \hline 3 & 17.2387 \\ \hline 4 & 21.2936 \\ \hline 5 & 42.6284 \\ \hline 6 & 73.2261 \\ \hline \end{tabular} blood 25015 table. \begin{tabular}{|ll|} \hline Workspace & \\ \hline Name & Value \\ #y & 121 double \\ x & 121 double \\ # t & {[0;8;24;32;48;56]} \\ cells & {[3.2727;3.3869;1} \\ blood & 25015 table \end{tabular} to load variables x,y,t, cells, and blood into the workspace. Variables t and cells contain six cell counts for dividing mammalian cells in a culture dish. (The times in t are in hours.) Your task is to find the exponential growth rate of the cells using linear regression. For this problem, you are not allowed to use fitlm, regress, polyfit, or any other linear regression or curve fitting tools. a.) Set up a model matrix for the linearized exponential growth equation from section 9.4. I place your code here b.) Calculate the pseudoinverse of the model matrix and use it to fit your model. 2. place your code here c.) Calculate the exponential growth rate of the cells. What are the units? t=0h in your data? place your answer here> e.) Show the original data as a scatter plot using scatter and the fitted linear model as a line using plot. Both the data and the model should be on the same figure. figure; \%. Plot data using scatter \% Keep using the same figure by setting the hold on. \%. You don't need to add any code here. hold on: \% Plot model predictions as a tine using plot \% Add axes labels gr Release the hold hold off; f.) Use your model to predict the number of cells at each time point in t. Store the predictions in a variable ypred. p place your code here g.) Calculate the root mean squared error (RMSE) for the fitted model using the sqrt and sum functions. 8 place your code here
