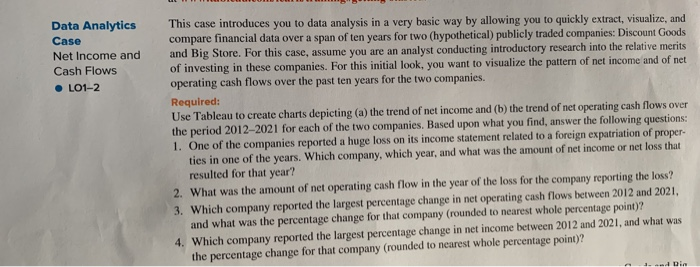
Data Analytics Case Net Income and Cash Flows LO1-2 This case introduces you to data analysis in a very basic way by allowing you to quickly extract, visualize, and compare financial data over a span of ten years for two (hypothetical) publicly traded companies: Discount Goods and Big Store. For this case, assume you are an analyst conducting introductory research into the relative merits of investing in these companies. For this initial look, you want to visualize the pattern of net income and of net operating cash flows over the past ten years for the two companies. Required: Use Tableau to create charts depicting (a) the trend of net income and (b) the trend of net operating cash flows over the period 2012-2021 for each of the two companies. Based upon what you find answer the following questions: 1. One of the companies reported a huge loss on its income statement related to a foreign expatriation of proper ties in one of the years. Which company, which year, and what was the amount of net income or net loss that resulted for that year? 2. What was the amount of net operating cash flow in the year of the loss for the company reporting the loss? 3. Which company reported the largest percentage change in net operating cash flows between 2012 and 2021, and what was the percentage change for that company (rounded to nearest whole percentage point)? 4. Which company reported the largest percentage change in net income between 2012 and 2021, and what was the percentage change for that company (rounded to nearest whole percentage point)? 3. Din Data Analytics Case Net Income and Cash Flows LO1-2 This case introduces you to data analysis in a very basic way by allowing you to quickly extract, visualize, and compare financial data over a span of ten years for two (hypothetical) publicly traded companies: Discount Goods and Big Store. For this case, assume you are an analyst conducting introductory research into the relative merits of investing in these companies. For this initial look, you want to visualize the pattern of net income and of net operating cash flows over the past ten years for the two companies. Required: Use Tableau to create charts depicting (a) the trend of net income and (b) the trend of net operating cash flows over the period 2012-2021 for each of the two companies. Based upon what you find answer the following questions: 1. One of the companies reported a huge loss on its income statement related to a foreign expatriation of proper ties in one of the years. Which company, which year, and what was the amount of net income or net loss that resulted for that year? 2. What was the amount of net operating cash flow in the year of the loss for the company reporting the loss? 3. Which company reported the largest percentage change in net operating cash flows between 2012 and 2021, and what was the percentage change for that company (rounded to nearest whole percentage point)? 4. Which company reported the largest percentage change in net income between 2012 and 2021, and what was the percentage change for that company (rounded to nearest whole percentage point)? 3. Din


