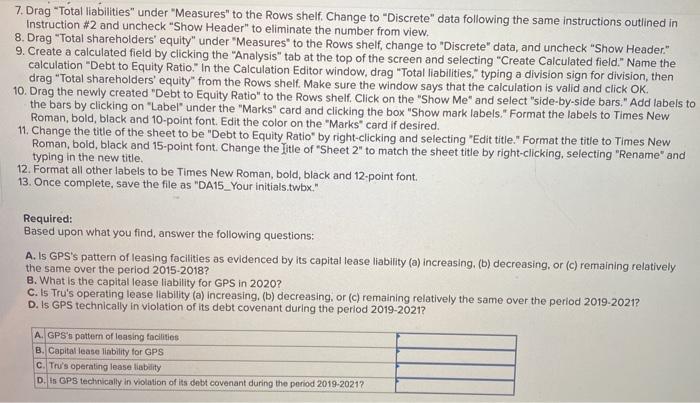
Data analytics is the process of examining data sets in order to draw conclusions about the information they contain. If you haven't completed any of the prior data analytics cases, follow the instructions listed in the Chapter 1 Data Analytics case to get set up. You will need to watch the videos referred to in the Chapters 1-3 Data Analytics cases, No additional videos are required for this case. All short training videos can be found here. In the Data Analytics Cases in prior chapters, you used Tableau to examine a data set and create charts to compare two (hypothetical) publicly traded companies, Big Store and Discount Goods. In this chapter, you will examine GPS Corporation and Tru, Inc. on the basis of various financial metrics. In this case you examine the companies' pattern of leasing facilities, their transition to the new lease accounting standard in 2019, and the effect of that transition on debt covenants. Since 2019 operating leases have been reported in the balance sheet of the lessee as a right-of-use asset and lease liability. Many companies at the time had debt covenants restricting the amount of debt during loan periods. GPS Corporation and True, Inc. had as part of their loan agreements a requirement that the debt to equity ratio could not exceed 2.0 without being in default of the loans. Tableau Instructions: Download the "GPS Tru_Financials.xlsx" Excel file available in Connect, or under Student Resources within the Library tab. Save it to the computer on which you will be using Tableau. For this case, you will create a calculation to produce the debt to equity ratio to allow you to compare and contrast the two companies. After you view the training videos, follow these steps to create the charts you'll use for this case: 1. Open Tableau and connect to the Excel spreadsheet you downloaded. 2. Starting on the Sheet 1 tab, drag "Company" and "Year" under "Dimensions" to the Columns shelf. Change "Year" to discrete by right- clicking and selecting "Discrete Select "Show 'Filter" and uncheck all the years except 2015 - 2021. Click "OK" 3. Drag "Capital lease liability", "Lease liability - operating lease". "Lease liability - finance lease" under "Measures" into the Rows shelf 4. Add labels to the bars by clicking on "Label" under the "Marks" card and clicking the box "Show mark label." Format the labels to Times New Roman, bold, black and 10-point font Edit the color of the years on the "Marks" card if desired by dragging "Year" on to the Color "Marks" card. 5. Change the title of the sheet to be "Lease Liability by right-clicking and selecting "Edit title." Format the title to Times New Roman, bold, black and 15-point font. Change the title of "Sheet 1" to match the sheet title by right-clicking, selecting "Rename" and typing in the new title 6. Click on the New Worksheet tab on the lower left ("Sheet 2" should open) and follow the procedure outlined in Instruction #2 for the 7. Drag "Total liabilities" under "Measures" to the Rows shelf. Change to "Discrete" data following the same instructions outlined in Instruction #2 and uncheck"Show Header" to eliminate the number from view, 8. Drag "Total shareholders' equity" under "Measures to the Rows shelf, change to "Discrete" data, and uncheck "Show Header." 9. Create a calculated field by clicking the "Analysis" tab at the top of the screen and selecting "Create Calculated field." Name the calculation "Debt to Equity Ratio" in the Calculation Editor window, drag "Total liabilities." typing a division sign for division, then drag "Total shareholders' equity" from the Rows shelf. Make sure the window says that the calculation is valid and click OK 10. Drag the newly created "Debt to Equity Ratio" to the Rows shelf. Click on the "Show Me" and select "side-by-side bars." Add labels to the bars by clicking on "Label" under the "Marks" card and clicking the box "Show mark labels." Format the labels to Times New Roman, bold, black and 10-point font. Edit the color on the "Marks card if desired. 11. Change the title of the sheet to be "Debt to Equity Ratio" by right-clicking and selecting "Edit title." Format the title to Times New Roman, bold, black and 15-point font. Change the Title of "Sheet 2" to match the sheet title by right-clicking, selecting "Rename" and typing in the new title. 12. Format all other labels to be Times New Roman, bold, black and 12-point font. 13. Once complete, save the file as "DA15_Your initials.twbx." Required: Based upon what you find answer the following questions: A. Is GPS's pattern of leasing facilities as evidenced by its capital lease liability (a) increasing, (b) decreasing, or (c) remaining relatively the same over the period 2015-2018? B. What is the capital lease liability for GPS in 2020? C. Is Tru's operating lease liability (a) Increasing. (b) decreasing, or (c) remaining relatively the same over the period 2019-2021? D. Is GPS technically in violation of its debt covenant during the period 2019-2021? A. GPS's pattern of leasing facilities B. Capital lease liability for GPS c. Tru's operating lease liability D.is GPS technically in violation of its debt covenant during the period 2019-2021? Data analytics is the process of examining data sets in order to draw conclusions about the information they contain. If you haven't completed any of the prior data analytics cases, follow the instructions listed in the Chapter 1 Data Analytics case to get set up. You will need to watch the videos referred to in the Chapters 1-3 Data Analytics cases, No additional videos are required for this case. All short training videos can be found here. In the Data Analytics Cases in prior chapters, you used Tableau to examine a data set and create charts to compare two (hypothetical) publicly traded companies, Big Store and Discount Goods. In this chapter, you will examine GPS Corporation and Tru, Inc. on the basis of various financial metrics. In this case you examine the companies' pattern of leasing facilities, their transition to the new lease accounting standard in 2019, and the effect of that transition on debt covenants. Since 2019 operating leases have been reported in the balance sheet of the lessee as a right-of-use asset and lease liability. Many companies at the time had debt covenants restricting the amount of debt during loan periods. GPS Corporation and True, Inc. had as part of their loan agreements a requirement that the debt to equity ratio could not exceed 2.0 without being in default of the loans. Tableau Instructions: Download the "GPS Tru_Financials.xlsx" Excel file available in Connect, or under Student Resources within the Library tab. Save it to the computer on which you will be using Tableau. For this case, you will create a calculation to produce the debt to equity ratio to allow you to compare and contrast the two companies. After you view the training videos, follow these steps to create the charts you'll use for this case: 1. Open Tableau and connect to the Excel spreadsheet you downloaded. 2. Starting on the Sheet 1 tab, drag "Company" and "Year" under "Dimensions" to the Columns shelf. Change "Year" to discrete by right- clicking and selecting "Discrete Select "Show 'Filter" and uncheck all the years except 2015 - 2021. Click "OK" 3. Drag "Capital lease liability", "Lease liability - operating lease". "Lease liability - finance lease" under "Measures" into the Rows shelf 4. Add labels to the bars by clicking on "Label" under the "Marks" card and clicking the box "Show mark label." Format the labels to Times New Roman, bold, black and 10-point font Edit the color of the years on the "Marks" card if desired by dragging "Year" on to the Color "Marks" card. 5. Change the title of the sheet to be "Lease Liability by right-clicking and selecting "Edit title." Format the title to Times New Roman, bold, black and 15-point font. Change the title of "Sheet 1" to match the sheet title by right-clicking, selecting "Rename" and typing in the new title 6. Click on the New Worksheet tab on the lower left ("Sheet 2" should open) and follow the procedure outlined in Instruction #2 for the 7. Drag "Total liabilities" under "Measures" to the Rows shelf. Change to "Discrete" data following the same instructions outlined in Instruction #2 and uncheck"Show Header" to eliminate the number from view, 8. Drag "Total shareholders' equity" under "Measures to the Rows shelf, change to "Discrete" data, and uncheck "Show Header." 9. Create a calculated field by clicking the "Analysis" tab at the top of the screen and selecting "Create Calculated field." Name the calculation "Debt to Equity Ratio" in the Calculation Editor window, drag "Total liabilities." typing a division sign for division, then drag "Total shareholders' equity" from the Rows shelf. Make sure the window says that the calculation is valid and click OK 10. Drag the newly created "Debt to Equity Ratio" to the Rows shelf. Click on the "Show Me" and select "side-by-side bars." Add labels to the bars by clicking on "Label" under the "Marks" card and clicking the box "Show mark labels." Format the labels to Times New Roman, bold, black and 10-point font. Edit the color on the "Marks card if desired. 11. Change the title of the sheet to be "Debt to Equity Ratio" by right-clicking and selecting "Edit title." Format the title to Times New Roman, bold, black and 15-point font. Change the Title of "Sheet 2" to match the sheet title by right-clicking, selecting "Rename" and typing in the new title. 12. Format all other labels to be Times New Roman, bold, black and 12-point font. 13. Once complete, save the file as "DA15_Your initials.twbx." Required: Based upon what you find answer the following questions: A. Is GPS's pattern of leasing facilities as evidenced by its capital lease liability (a) increasing, (b) decreasing, or (c) remaining relatively the same over the period 2015-2018? B. What is the capital lease liability for GPS in 2020? C. Is Tru's operating lease liability (a) Increasing. (b) decreasing, or (c) remaining relatively the same over the period 2019-2021? D. Is GPS technically in violation of its debt covenant during the period 2019-2021? A. GPS's pattern of leasing facilities B. Capital lease liability for GPS c. Tru's operating lease liability D.is GPS technically in violation of its debt covenant during the period 2019-2021