Answered step by step
Verified Expert Solution
Link Copied!

Question

1 Approved Answer

Data colected on the yearly registrafions for a Six Sigma seminar at the Quasily College are shown in the followiog table: begin{tabular}{lccccccccccc|} hline Year &
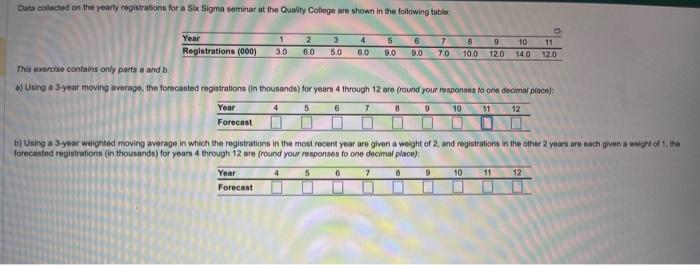
image text in transcribed
Data colected on the yearly registrafions for a Six Sigma seminar at the Quasily College are shown in the followiog table: \begin{tabular}{lccccccccccc|} \hline Year & 1 & 2 & 3 & 4 & 5 & 6 & 7 & 8 & 9 & 10 & 11 \\ \hline Regietrations (000) & 3.0 & 6.0 & 5.0 & 6.0 & 9.0 & 9.0 & 7.0 & 10.0 & 12.0 & 14.0 & 12.0 \\ \hline \end{tabular} This exereise contains an'y parts a and b. a) Using a 3year moving average, the forecasted registrations (in thousands) for years 4 through 12 are (round your reaponses to one decimal place): \begin{tabular}{lllllllllll} \hline Year & 4 & 5 & 6 & 7 & 8 & 9 & 10 & 11 & 12 \\ \hline Forecast & & & & & & & & & \\ \hline \end{tabular} b) Using a 3.year weighted moving average in which the registrations in the most recent year are given a weight of 2 , and registrations in the other 2 years are each given a weight of 1, the forecasted registrations (in thousands) for years 4 through 12 are (round your responses fo one decimal place)

Step by Step Solution

There are 3 Steps involved in it

Step: 1

blur-text-image

Get Instant Access to Expert-Tailored Solutions

See step-by-step solutions with expert insights and AI powered tools for academic success

Step: 2

blur-text-image

Step: 3

blur-text-image

Ace Your Homework with AI

Get the answers you need in no time with our AI-driven, step-by-step assistance

Get Started

Recommended Textbook for

Encompassing The Future Offshore Oil And Gas Operations Environment Health And Safety Performance Management Policy Economics Law And Environment

Authors: William J. Cairns; Ann G Wilkie; Judith Hackitt; Peter Hepburn; Ewan MacAngus; Rita Marcella; Hayley

1st Edition

1999766210, 9781999766214

More Books

Students also viewed these General Management questions