Data Collection Use the data set you collected for the Week 5 lab (heights of 10 different people plus the 10 heights provided by your
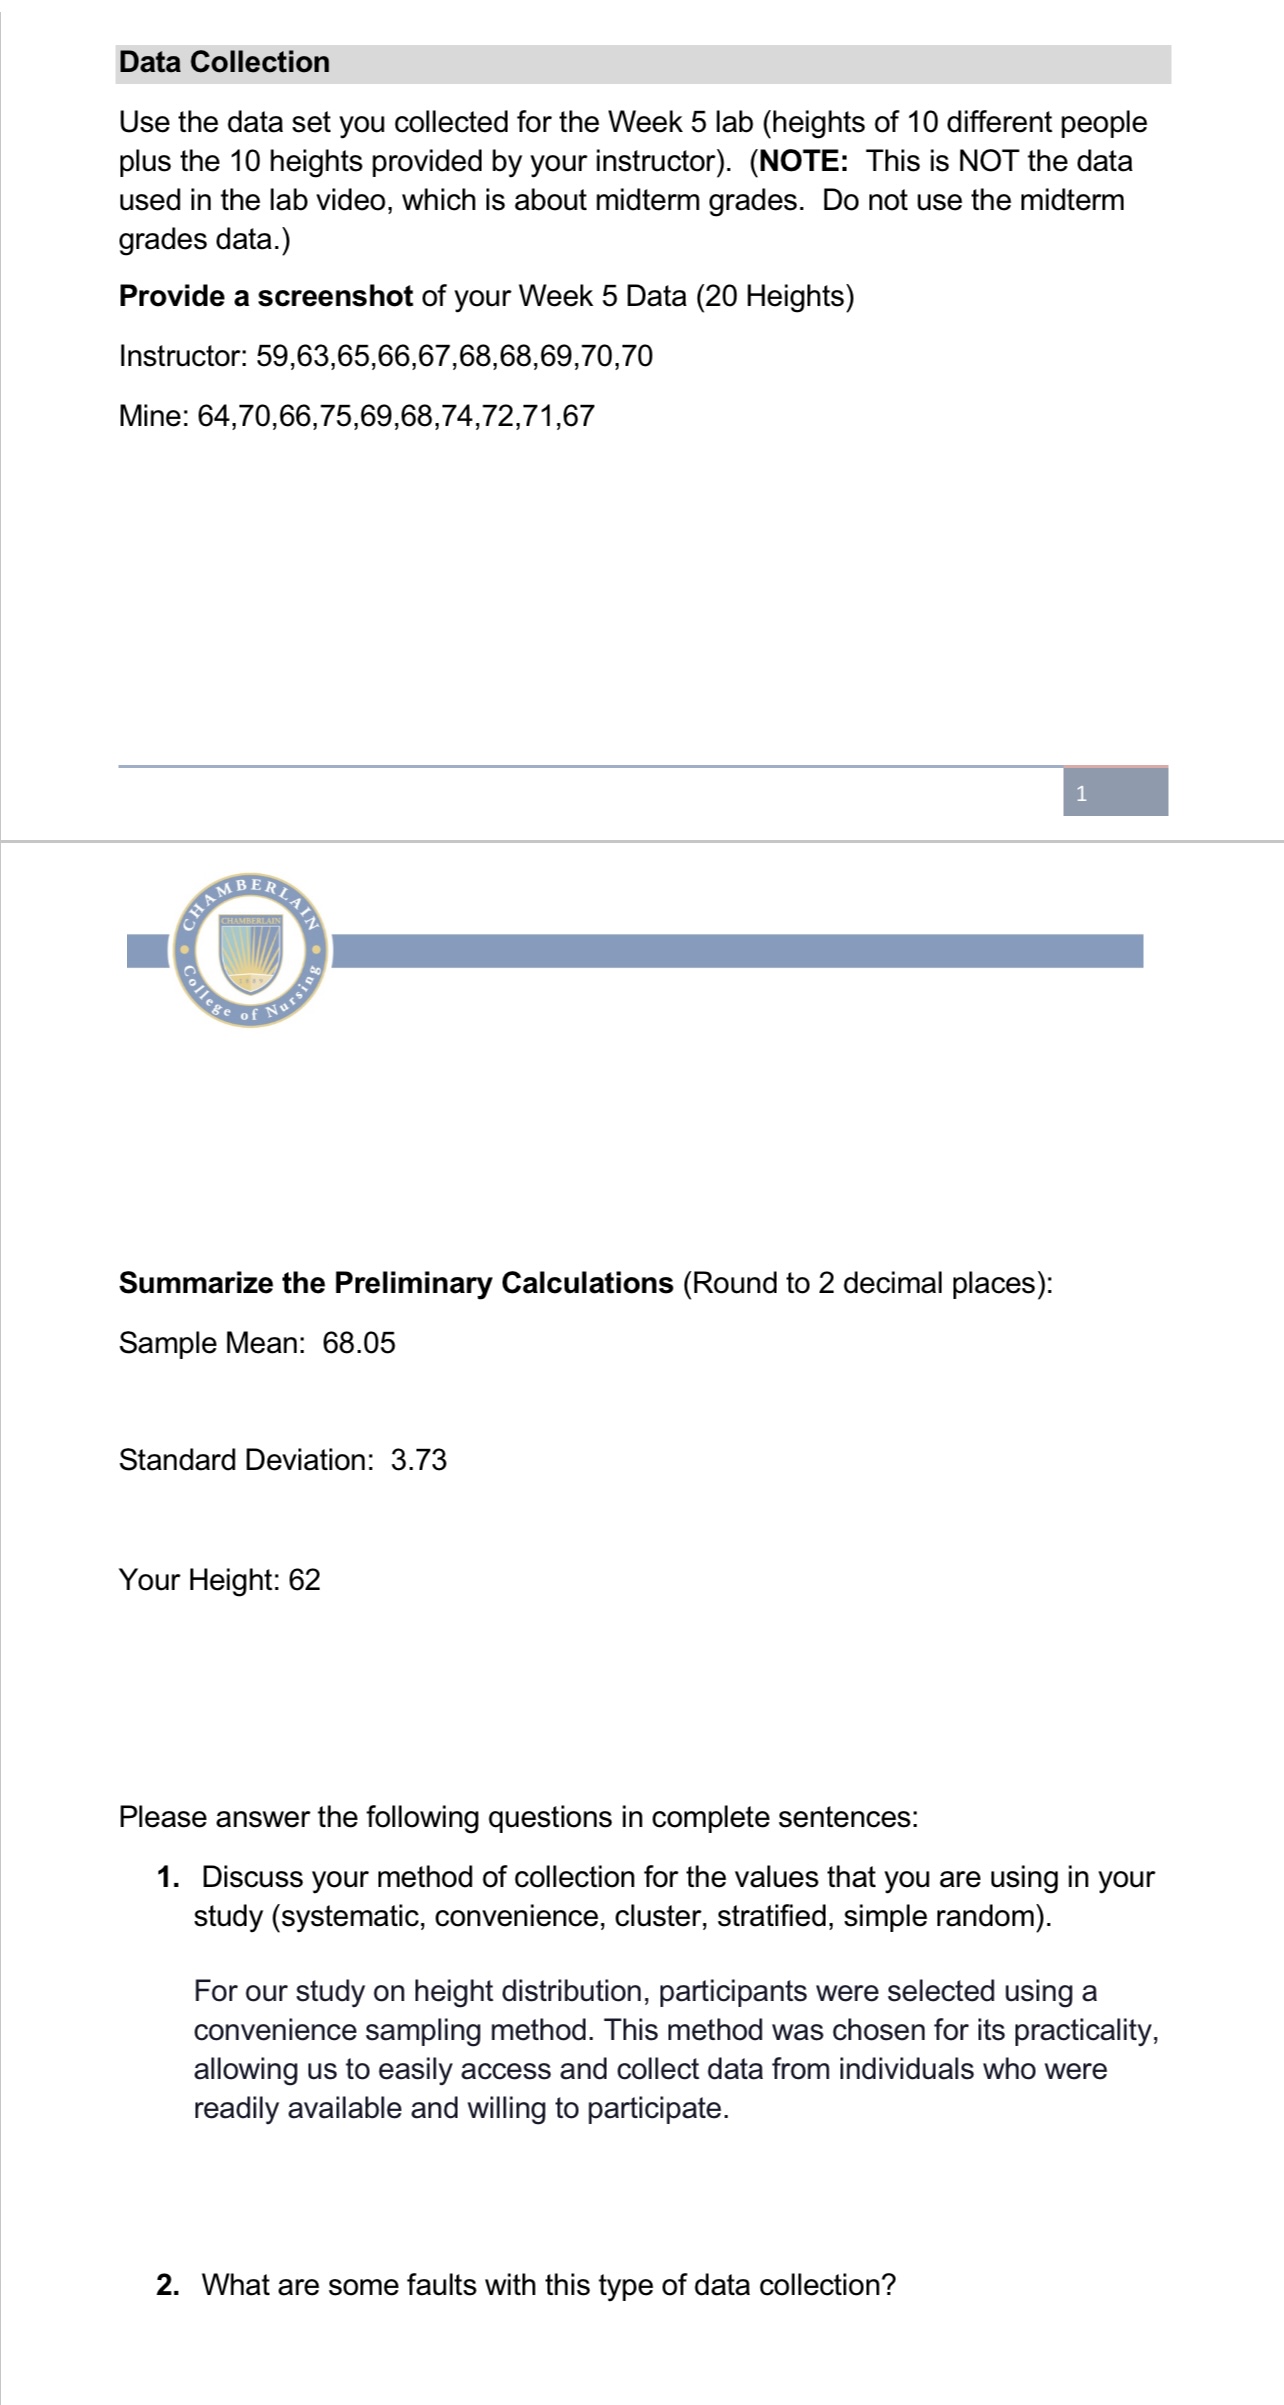
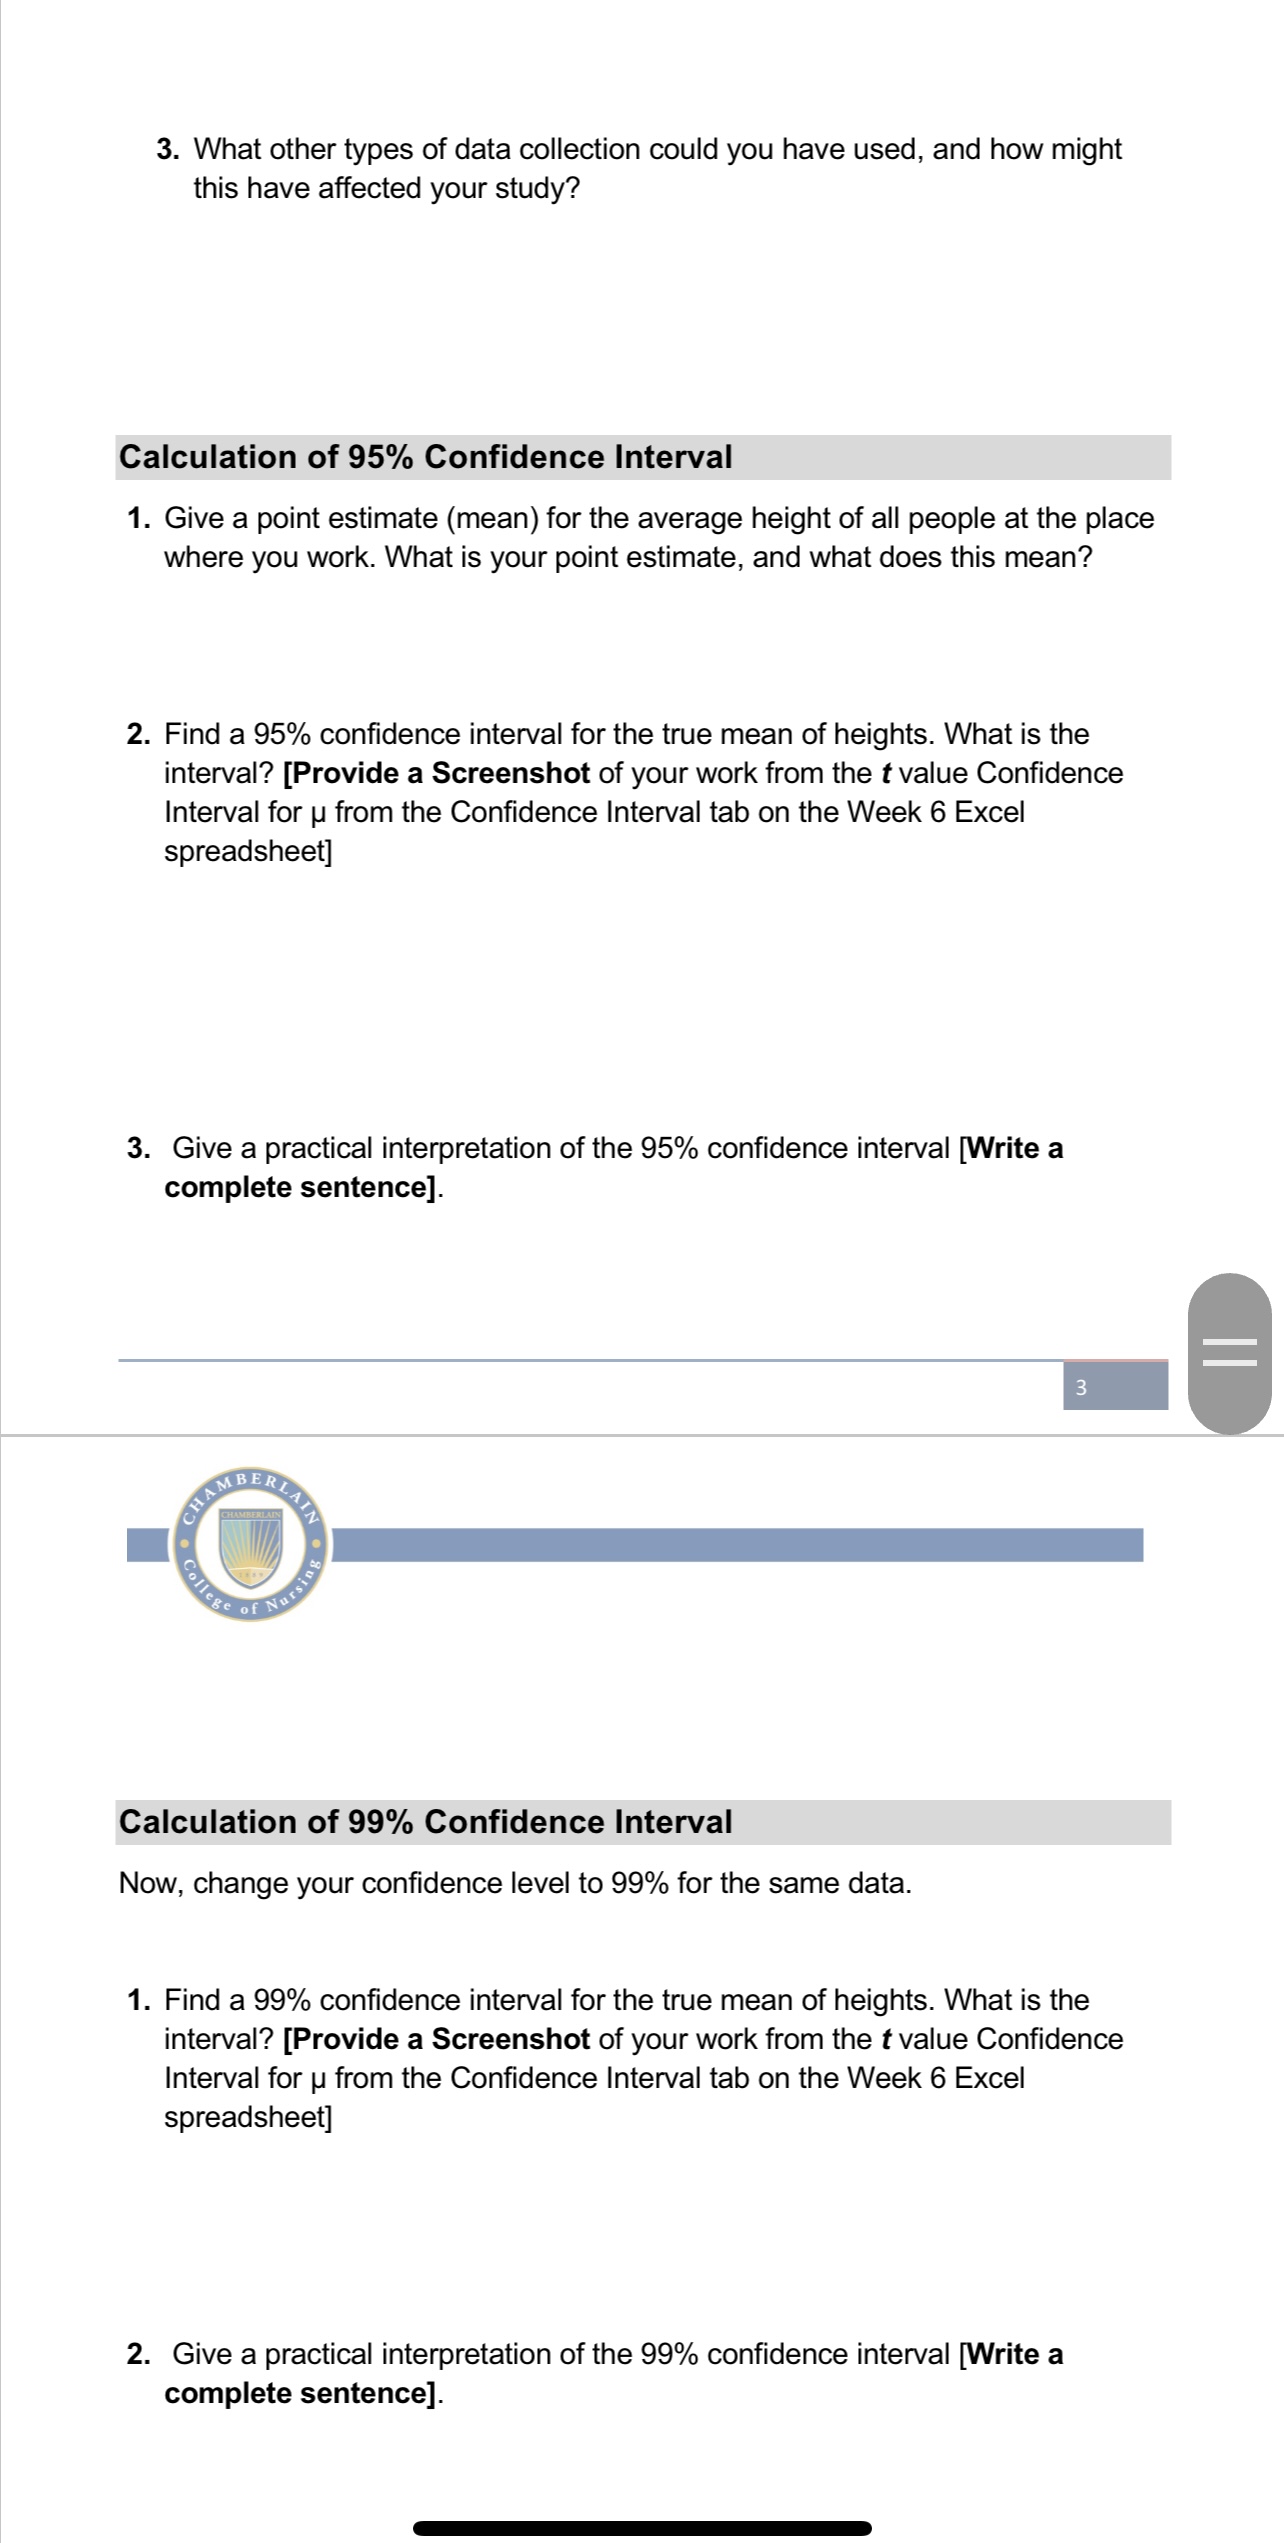
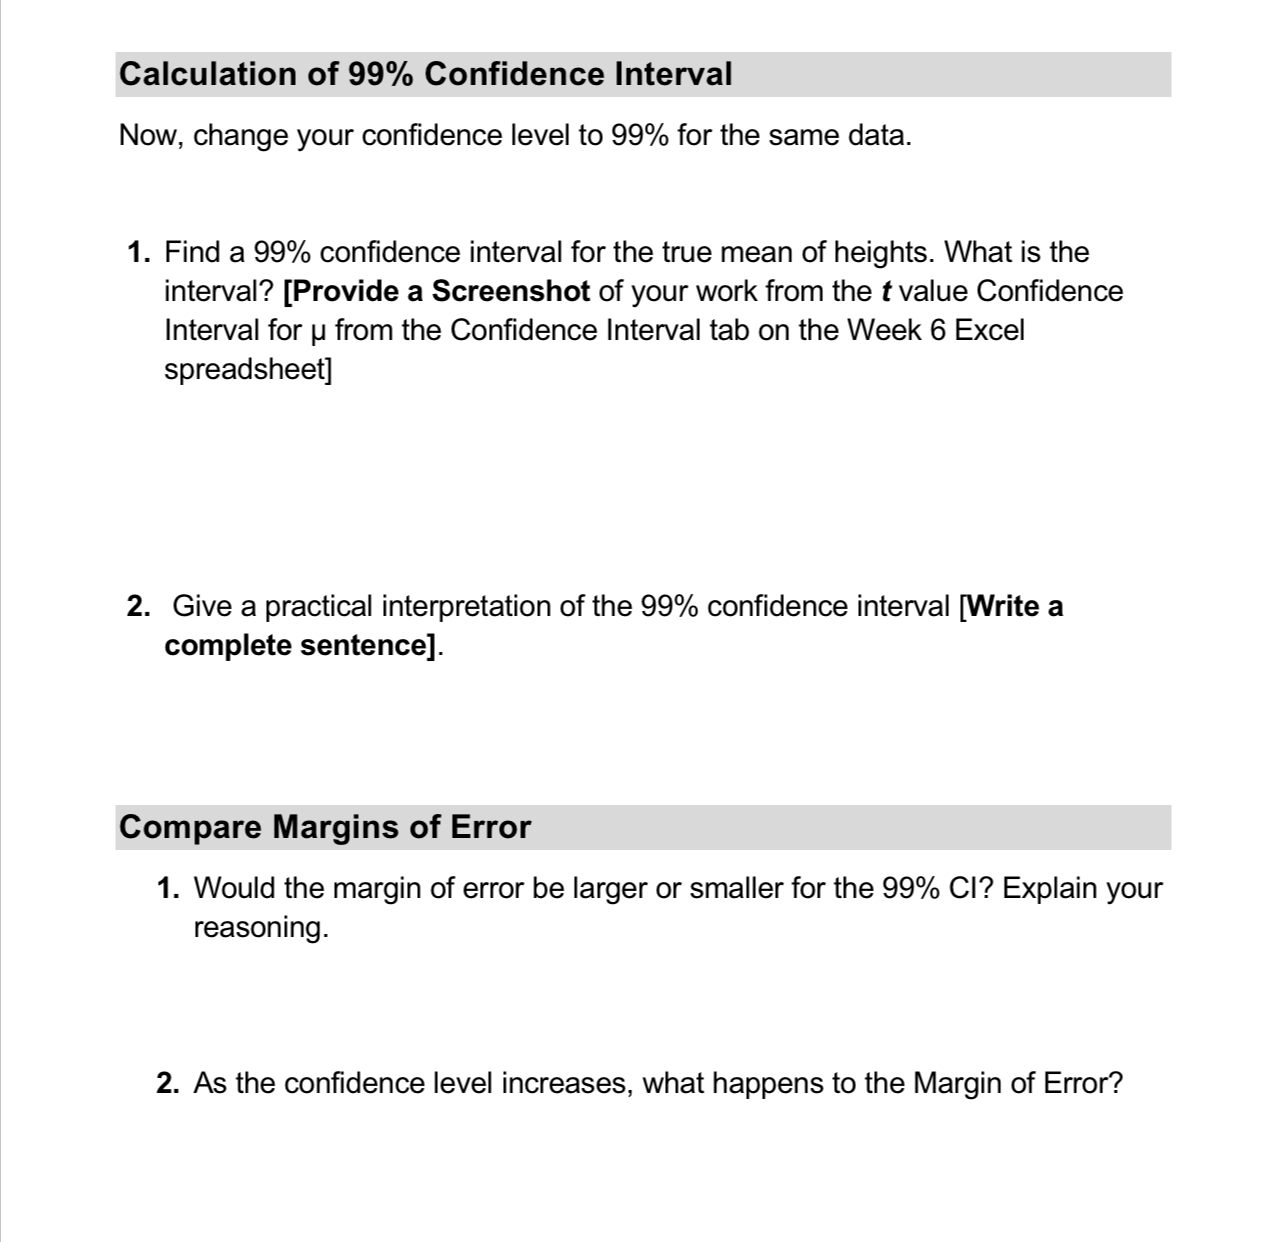
Data Collection Use the data set you collected for the Week 5 lab (heights of 10 different people plus the 10 heights provided by your instructor). (NOTE: This is NOT the data used in the lab video, which is about midterm grades. Do not use the midterm grades data.) Provide a screenshot of your Week 5 Data (20 Heights) Instructor: 59,63,65,66,67,68,68,69,70,70 Mine: 64,70,66,75,69,68,74,72,71,67 Summarize the Preliminary Calculations (Round to 2 decimal places): Sample Mean: 68.05 Standard Deviation: 3.73 Your Height: 62 Please answer the following questions in complete sentences: 1. Discuss your method of collection for the values that you are using in your study (systematic, convenience, cluster, stratified, simple random). For our study on height distribution, participants were selected using a convenience sampling method. This method was chosen for its practicality, allowing us to easily access and collect data from individuals who were readily available and willing to participate. 2. What are some faults with this type of data collection? 3. What other types of data collection could you have used, and how might this have affected your study? Calculation of 95% Confidence Interval 1. Give a point estimate (mean) for the average height of all people at the place where you work. What is your point estimate, and what does this mean? 2. Find a 95% confidence interval for the true mean of heights. What is the interval? [Provide a Screenshot of your work from the t value Confidence Interval for p from the Confidence Interval tab on the Week 6 Excel spreadsheet] 3. Give a practical interpretation of the 95% confidence interval [Write a complete sentence]. Calculation of 99% Confidence Interval Now, change your confidence level to 99% for the same data. 1. Find a 99% confidence interval for the true mean of heights. What is the interval? [Provide a Screenshot of your work from the t value Confidence Interval for p from the Confidence Interval tab on the Week 6 Excel spreadsheet] 2. Give a practical interpretation of the 99% confidence interval [Write a complete sentence]. Calculation of 99% Confidence Interval Now, change your confidence level to 99% for the same data. 1. Find a 99% confidence interval for the true mean of heights. What is the interval? [Provide a Screenshot of your work from the value Confidence Interval for y from the Confidence Interval tab on the Week 6 Excel spreadsheet] 2. Give a practical interpretation of the 99% confidence interval [Write a complete sentence]. Compare Margins of Error 1. Would the margin of error be larger or smaller for the 99% CI? Explain your reasoning. 2. As the confidence level increases, what happens to the Margin of Error
Step by Step Solution
There are 3 Steps involved in it
Step: 1
Get Instant Access to Expert-Tailored Solutions
See step-by-step solutions with expert insights and AI powered tools for academic success
Step: 2
Step: 3
Ace Your Homework with AI
Get the answers you need in no time with our AI-driven, step-by-step assistance