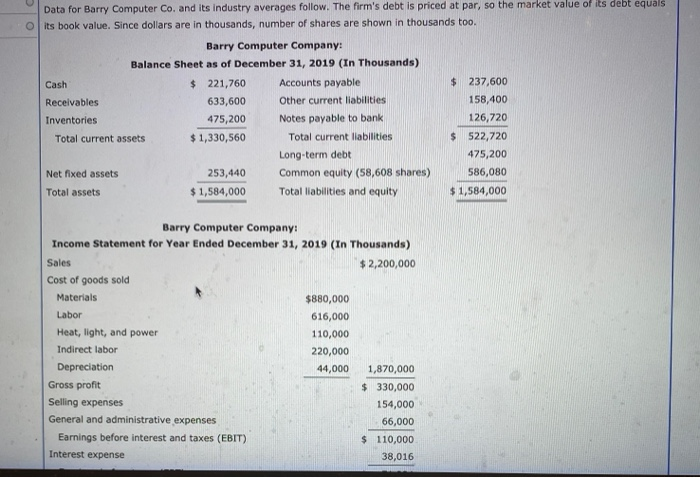
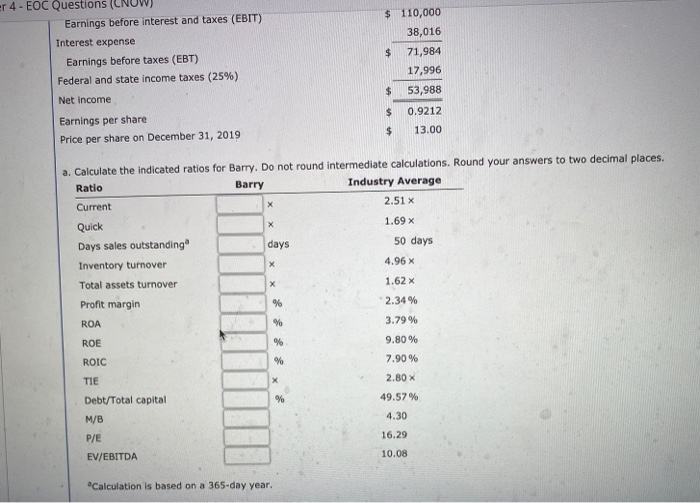
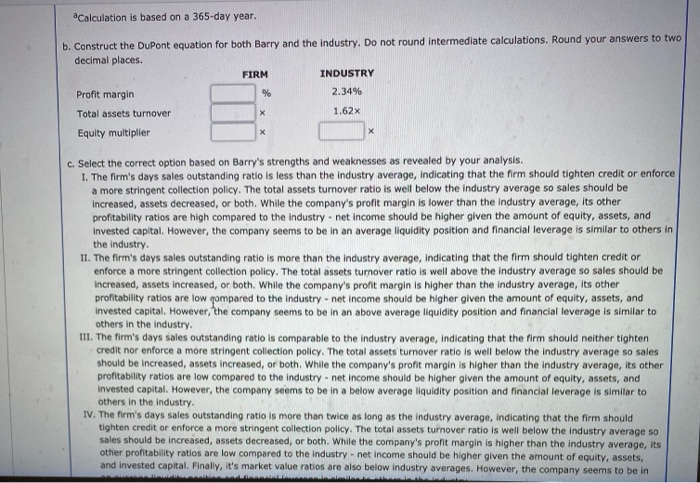
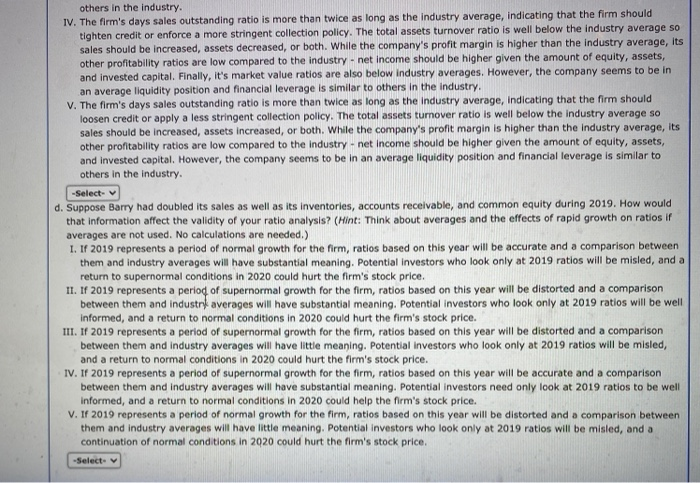
Data for Barry Computer Co. and its industry averages follow. The firm's debt is priced at par, so the market value of its debt equals o its book value. Since dollars are in thousands, number of shares are shown in thousands too. Barry Computer Company: Balance Sheet as of December 31, 2019 (In Thousands) Cash $ 221,760 Accounts payable $ 237,600 Receivables 633,600 Other current liabilities 158,400 Inventories 475,200 Notes payable to bank 126,720 Total current assets $1,330,560 Total current liabilities $ 522,720 Long-term debt 475,200 Net fixed assets 253,440 Common equity (58,608 shares) 586,080 Total assets $1,584,000 Total liabilities and equity $ 1,584,000 Barry Computer Company: Income Statement for Year Ended December 31, 2019 (In Thousands) Sales $ 2,200,000 Cost of goods sold Materials $880,000 Labor 616,000 Heat, light, and power 110,000 Indirect labor 220,000 Depreciation 44,000 1,870,000 Gross profit $ 330,000 Selling expenses 154,000 General and administrative expenses 66,000 Earnings before interest and taxes (EBIT) $ 110,000 Interest expense 38,016 $ 110,000 38,016 $ 71,984 er 4 - EOC Questions (CNOW Earnings before interest and taxes (EBIT) Interest expense Earnings before taxes (EBT) Federal and state income taxes (25%) Net income Earnings per share Price per share on December 31, 2019 17,996 $ 53,988 $ $ 0.9212 13.00 a. Calculate the indicated ratios for Barry. Do not round intermediate calculations. Round your answers to two decimal places. Ratio Barry Industry Average Current 2.51 x X 1.69 x days 50 days 4.96 x Quick Days sales outstanding Inventory turnover Total assets turnover Profit margin ROA X 1.62 x 2.34% % % 3.79% ROE % 9.80 % % ROIC TIE 7.90% 2.80 x X % 49.57% Debt/Total capital M/B 4.30 P/E 16.29 EV/EBITDA 10.08 Calculation is based on a 365-day year. a calculation is based on a 365-day year. b. Construct the DuPont equation for both Barry and the industry. Do not round intermediate calculations. Round your answers to two decimal places. FIRM INDUSTRY Profit margin % 2.34% 1.62 Total assets turnover Equity multiplier X X c. Select the correct option based on Barry's strengths and weaknesses as revealed by your analysis. I. The firm's days sales outstanding ratio is less than the industry average, indicating that the firm should tighten credit or enforce a more stringent collection policy. The total assets turnover ratio is well below the industry average so sales should be Increased, assets decreased, or both. While the company's profit margin is lower than the industry average, its other profitability ratios are high compared to the industry - net income should be higher given the amount of equity, assets, and invested capital. However, the company seems to be in an average liquidity position and financial leverage is similar to others in the industry. II. The firm's days sales outstanding ratio is more than the industry average, indicating that the firm should tighten credit or enforce a more stringent collection policy. The total assets turnover ratio is well above the industry average so sales should be increased, assets increased, or both. While the company's profit margin is higher than the industry average, its other profitability ratios are low compared to the industry - net income should be higher given the amount of equity, assets, and invested capital. However, the company seems to be in an above average liquidity position and financial leverage is similar to others in the industry III. The firm's days sales outstanding ratio is comparable to the industry average, indicating that the firm should neither tighten credit nor enforce a more stringent collection policy. The total assets turnover ratio is well below the industry average so sales should be increased, assets increased, or both. While the company's profit margin is higher than the industry average, its other profitability ratios are low compared to the industry - net income should be higher given the amount of equity, assets, and Invested capital. However, the company seems to be in a below average liquidity position and financial leverage is similar to others in the industry. IV. The firm's days sales outstanding ratio is more than twice as long as the industry average, indicating that the firm should tighten credit or enforce a more stringent collection policy. The total assets turnover ratio is well below the industry average so sales should be increased, assets decreased, or both. While the company's profit margin is higher than the industry average, its other profitability ratios are low compared to the industry - net income should be higher given the amount of equity, assets, and invested capital. Finally, it's market value ratios are also below industry averages. However, the company seems to be in others in the industry. IV. The firm's days sales outstanding ratio is more than twice as long as the industry average, indicating that the firm should tighten credit or enforce a more stringent collection policy. The total assets turnover ratio is well below the industry average so sales should be increased, assets decreased, or both. While the company's profit margin is higher than the industry average, its other profitability ratios are low compared to the industry - net income should be higher given the amount of equity, assets, and invested capital. Finally, it's market value ratios are also below industry averages. However, the company seems to be in an average liquidity position and financial leverage is similar to others in the industry. V. The firm's days sales outstanding ratio is more than twice as long as the industry average, indicating that the firm should loosen credit or apply a less stringent collection policy. The total assets turnover ratio is well below the industry average so sales should be increased, assets increased, or both. While the company's profit margin is higher than the industry average, its other profitability ratios are low compared to the industry - net income should be higher given the amount of equity, assets, and invested capital. However, the company seems to be in an average liquidity position and financial leverage is similar to others in the industry. -Select- d. Suppose Barry had doubled its sales as well as its inventories, accounts receivable, and common equity during 2019. How would that information affect the validity of your ratio analysis? (Hint: Think about averages and the effects of rapid growth on ratios if averages are not used. No calculations are needed.) 1. If 2019 represents a period of normal growth for the firm, ratios based on this year will be accurate and a comparison between them and industry averages will have substantial meaning, Potential investors who look only at 2019 ratios will be misled, and a return to supernormal conditions in 2020 could hurt the firm's stock price. II. If 2019 represents a period of supernormal growth for the firm, ratios based on this year will be distorted and a comparison between them and industry averages will have substantial meaning. Potential investors who look only at 2019 ratios will be well informed, and a return to normal conditions in 2020 could hurt the firm's stock price. III. If 2019 represents a period of supernormal growth for the firm, ratios based on this year will be distorted and a comparison between them and industry averages will have little meaning. Potential investors who look only at 2019 ratios will be misled, and a return to normal conditions in 2020 could hurt the firm's stock price. IV. If 2019 represents a period of supernormal growth for the firm, ratios based on this year will be accurate and a comparison between them and industry averages will have substantial meaning. Potential investors need only look at 2019 ratios to be well informed, and a return to normal conditions in 2020 could help the firm's stock price. V. If 2019 represents a period of normal growth for the firm, ratios based on this year will be distorted and a comparison between them and industry averages will have little meaning, Potential investors who look only at 2019 ratios will be misled, and a continuation of normal conditions in 2020 could hurt the firm's stock price. -Select