Answered step by step
Verified Expert Solution
Link Copied!

Question

1 Approved Answer

Data for Mulberry Designs, Inc. follow: (Click the icon to view the data.) Read the requirements. Years Ended December 31, 2018 and 2017 2018 Increase
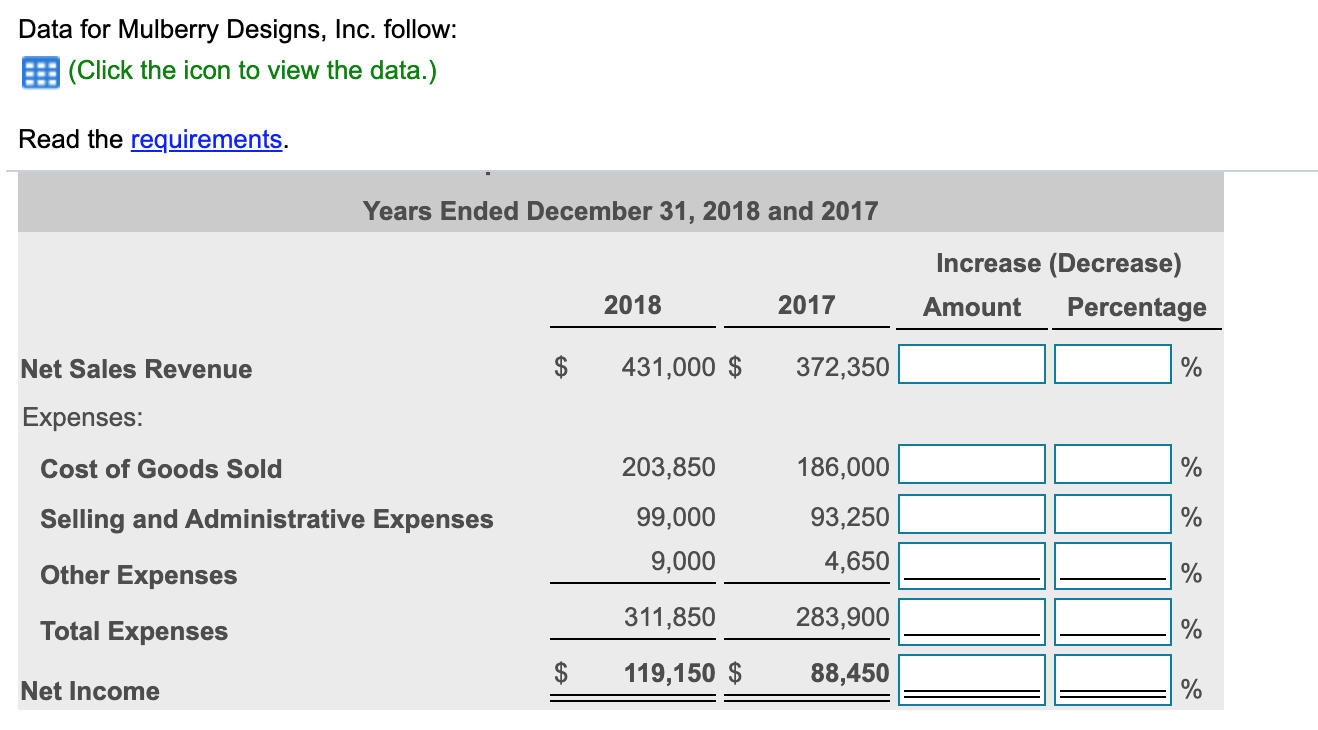
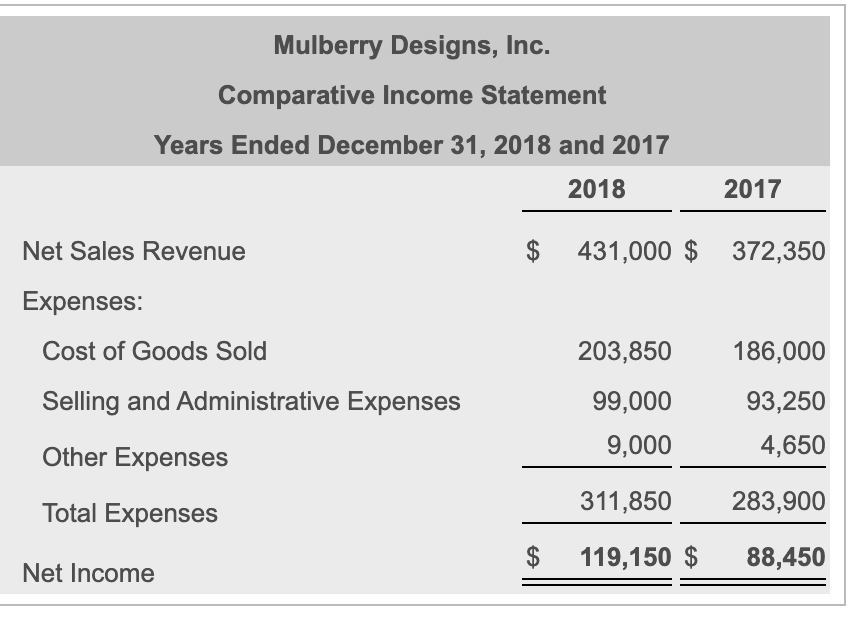
image text in transcribedimage text in transcribedimage text in transcribed

Data for Mulberry Designs, Inc. follow: (Click the icon to view the data.) Read the requirements. Years Ended December 31, 2018 and 2017 2018 Increase (Decrease) Amount Percentage 2017 Net Sales Revenue $ 431,000 $ 372,350 Expenses: Cost of Goods Sold 203,850 Selling and Administrative Expenses 99,000 9,000 186,000 93,250 4,650 Other Expenses Total Expenses 283,900 $ 119,150 $ 88,450 Net Income Mulberry Designs, Inc. Comparative Income Statement Years Ended December 31, 2018 and 2017 2018 2017 $ 431,000 $ 372,350 Net Sales Revenue Expenses: Cost of Goods Sold Selling and Administrative Expenses 203,850 99,000 9,000 186,000 93,250 4,650 Other Expenses Total Expenses 311,850 119,150 $ 283,900 88,450 $ Net Income 1. Prepare a horizontal analysis of the comparative income statement of Mulberry Designs, Inc. Round percentage changes to one decimal place. 2. Why did 2018 net income increase by a higher percentage than net sales revenue

Step by Step Solution

There are 3 Steps involved in it

Step: 1

blur-text-image

Get Instant Access to Expert-Tailored Solutions

See step-by-step solutions with expert insights and AI powered tools for academic success

Step: 2

blur-text-image

Step: 3

blur-text-image

Ace Your Homework with AI

Get the answers you need in no time with our AI-driven, step-by-step assistance

Get Started

Recommended Textbook for

Information Systems Control And Audit

Authors: Et Al. Hyo-Jeong Kim, Michael Mannino, Compiled By Koros Press Editorial Board

1st Edition

1781639426, 978-1781639429

More Books

Students also viewed these Accounting questions

Question

3. What are the current trends in computer hardware platforms?

Answered: 1 week ago