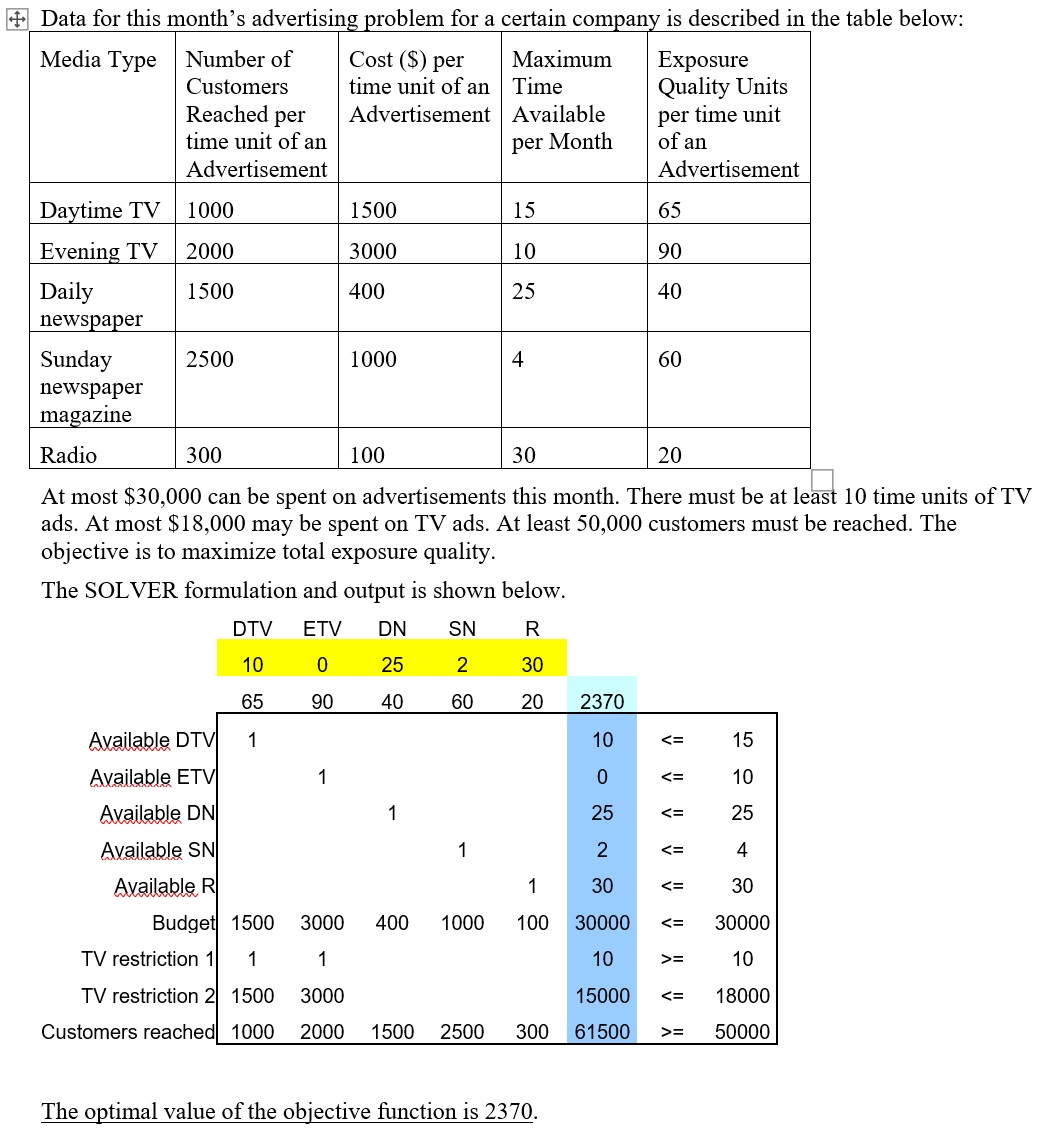
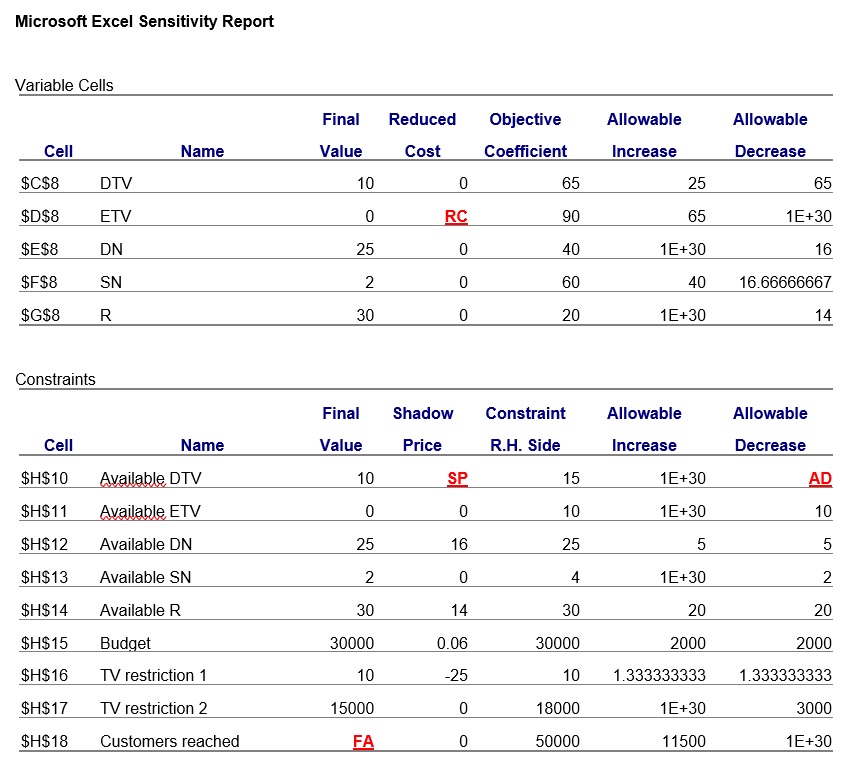
Data for this month's advertising problem for a certain company is described in the table below: Media Type Number of Cost ($) per Maximum Exposure Customers time unit of an Time Quality Units Reached per Advertisement Available per time unit time unit of an per Month of an Advertisement Advertisement Daytime TV 1000 1500 15 65 Evening TV 2000 3000 10 90 Daily 1500 400 25 40 newspaper Sunday 2500 1000 4 60 newspaper magazine Radio 300 100 30 20 At most $30,000 can be spent on advertisements this month. There must be at leas 10 time units of TV ads. At most $18,000 may be spent on TV ads. At least 50,000 customers must be reached. The objective is to maximize total exposure quality. The SOLVER formulation and output is shown below. DTV ETV DN SN R 10 0 25 2 30 65 90 40 60 20 2370 WI? 1 Budgel1500 3000 400 1000 100 TV restriction 1 TV restriction 2 1500 3000 Customers reached 1000 2000 1500 2500 300 The optimal value of the objective Jnction is 23 70. Microsoft Excel Sensitivity Report Variable Cells Final Reduced Objective Allowable Allowable Cell Name Value Cost Coefficient Increase Decrease $C$8 DTV 10 0 65 25 65 $D$8 ETV 0 RC 90 65 1E+30 $E$8 DN 25 0 40 1E+30 16 $F$8 SN 2 0 60 40 16.66666667 $G$8 R 30 0 20 1E+30 14 Constraints Final Shadow Constraint Allowable Allowable Cell Name Value Price R.H. Side Increase Decrease $H$10 Available DTV 10 SP 15 1E+30 AD $H$11 Available ETV 0 0 10 1E+30 10 $H$12 Available DN 25 16 25 5 5 $H$13 Available SN 2 0 4 1E+30 2 $H$14 Available R 30 14 30 20 20 $H$15 Budget 30000 0.06 30000 2000 2000 $H$16 TV restriction 1 10 -25 10 1.333333333 1.333333333 $H$17 TV restriction 2 15000 0 18000 1E+30 3000 $H$18 Customers reached FA 0 50000 11500 1E+30Number Item Description Value RC 2 SP 3 AD 4 FA