

Answered step by step
Verified Expert Solution
Question
1 Approved Answer
data from best buy : Requirements 1. Prepare comparative 2020 balance sheet in good form) for the company. Round all percents to tenths (0.0%). Prepare
data from best buy :
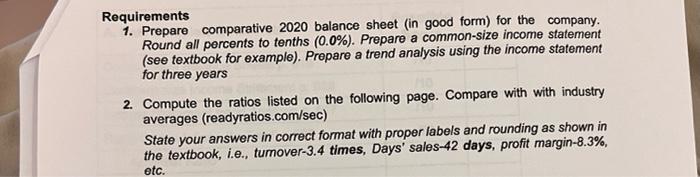
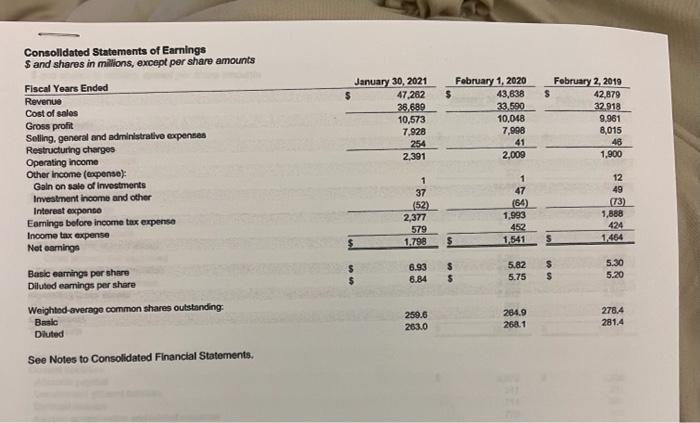
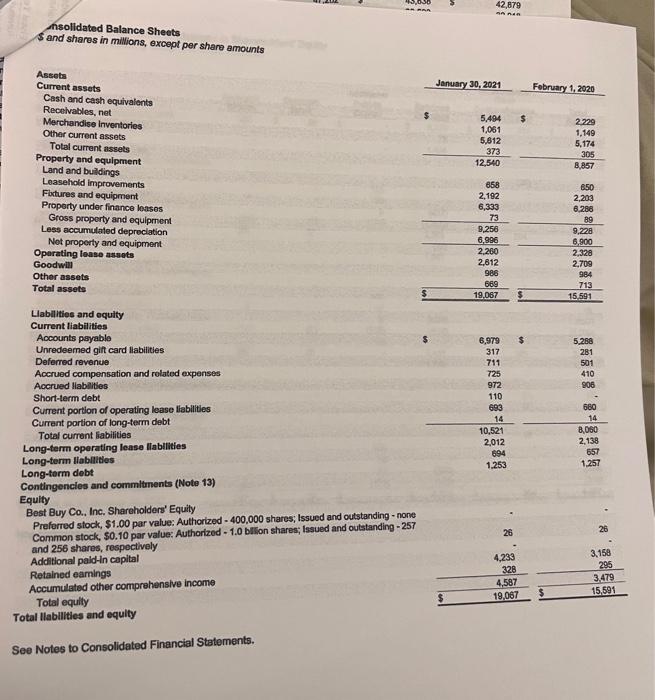
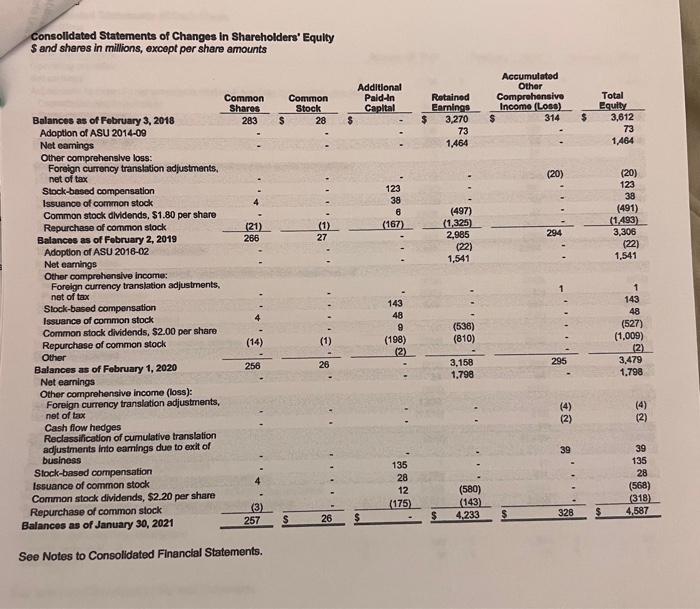
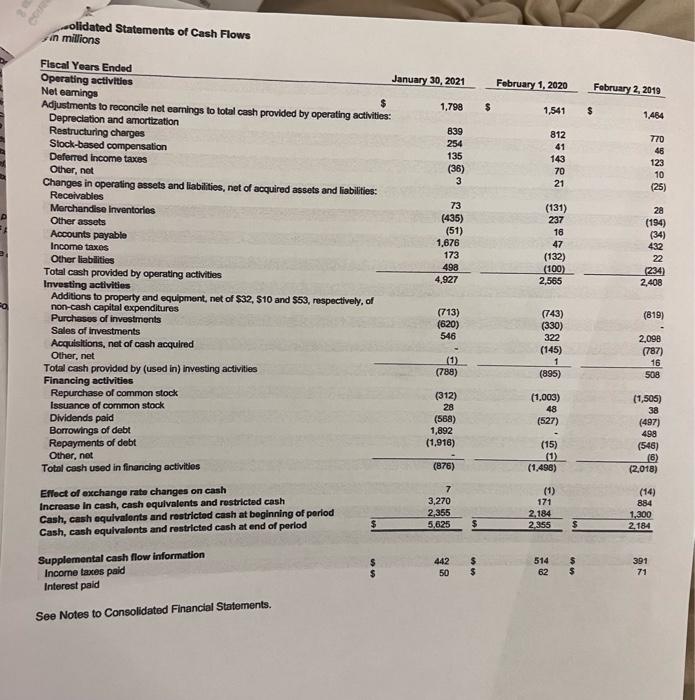
Requirements 1. Prepare comparative 2020 balance sheet in good form) for the company. Round all percents to tenths (0.0%). Prepare a common-size income statement (see textbook for example). Prepare a trend analysis using the income statement for three years 2. Compute the ratios listed on the following page. Compare with with industry averages (readyratios.com/sec) State your answers in correct format with proper labels and rounding as shown in the textbook, i.e., turnover-3.4 times, Days' sales-42 days, profit margin-8.3%, etc. Consolidated Statements of Earnings S and shares in milions, except per share amounts Fiscal Years Ended Revenue Cost of sales Gross profit Selling general and administrative expenses Restructuring charges Operating income Other Income (ponse): Gain on sale of Investments Investment income and other Interest expenso Eamingo before income tax expense Income tax expense Not earnings January 30, 2021 47,262 36.689 10,573 7,928 254 2,391 February 1, 2020 43,638 33.590 10,048 7.998 41 2,009 February 2, 2019 $ 42,879 32.918 9.961 8,015 46 1,900 1 37 (52) 2,377 579 1.799 1 47 (64) 1,993 452 1,541 12 49 (13) 1,888 424 1.464 5.30 6.93 8.84 $ $ 5.82 5.75 $ s 5.20 Basic earrings por share Diluted earnings per share Weighted average common shares outstanding Basic Diluted 259.6 263.0 2849 268.1 278.4 281.4 See Notes to Consolidated Financial Statements. "Os RA 42,879 nsolidated Balance Sheets $ and shares in millions, except per share amounts January 30, 2021 February 1, 2020 $ 2229 1,149 5494 1,061 5,812 373 12,540 5.174 305 8,857 Assets Current assets Cash and cash equivalents Receivables, net Merchandise Inventories Other current assets Total current assets Property and equipment Land and buildings Leasehold improvements Fixtures and equipment Property under finance leases Gross property and equipment Less accumulated depreciation Net property and equipment Operating lease assets Goodwill Other assets Total assets 858 2,192 6,333 73 9,256 6,996 2.260 2,612 988 669 19,067 650 2,203 6.288 89 9.228 6,900 2,328 2.709 984 713 15.591 6,979 317 711 5.286 281 501 410 906 Llabilities and equity Current liabilities Accounts payable Unredeemed gift card liabilities Deferred revenue Accrued compensation and related expenses Accrued kablities Short-term debt Current portion of operating lease liabilities Current portion of long-term debt Total current liabilities Long-term operating lease llabilities Long-term liabilities Long-term debt Contingencies and commitments (Note 13) Equity Best Buy Co., Inc. Shareholders' Equity Preferred stock, $1.00 par value: Authorized - 400,000 shares; Issued and outstanding - none Common stock, SO.10 par value: Authorized - 1.0 billion shares; Issued and outstanding - 257 and 256 shares, respectively Additional pald-In capital Retained earnings Accumulated other comprehensive Income Total eqully Total liabilities and equity 725 972 110 693 14 10,521 2,012 694 1.253 680 14 8,060 2.138 657 1.257 26 26 4,233 328 4,587 19,067 3.158 205 3,479 15,591 $ See Notes to Consolidated Financial Statements. Consolidated Statements of Changes in Shareholders' Equity S and shares in millions, except per share amounts Common Shares 283 Common Stock 28 Additional Pald-In Capital Ratainod Earnings 3,270 73 1,464 Accumulated Other Comprehensive Income (Loss) 314 $ Total Equity 3,612 73 1,464 (20) 123 38 6 (167) (20) 123 38 (491) (1.493) 3,306 (22) 1,541 (21) 266 (497) (1,325) 2,985 (22) 1,541 (1) 27 294 Balances as of February 3, 2018 Adoption of ASU 2014-09 Net camings Other comprehensive loss: Foreign currency translation adjustments, net of tax Stock-based compensation Issuance of common stock Common stock dividends, $1.80 per share Repurchase of common stock Balances as of February 2, 2019 Adoption of ASU 2016-02 Net earnings Other comprehensive Income: Foreign currency translation adjustments. net of tax Stock-based compensation Issuance of common stock Common stock dividends, $2.00 per share Repurchase of common stock Other Balances as of February 1, 2020 Net earnings Other comprehensive income (loss): Foreign currency translation adjustments, net of tax Cash flow hedges Reclassification of cumulative translation adjustments into earnings due to exit of business Stock-based compensation Issuance of common stock Common stock dividends, $2.20 per share Repurchase of common stock Balances as of January 30, 2021 143 48 9 (198) (2) (536) (810) 1 143 48 (527) (1,009) (2) 3,479 1.798 (14) (1) 256 26 295 3,158 1.798 (4) (2) (4) (2) 39 135 28 12 (175) 39 135 28 (568) (318) 4,587 (3) 257 (580) (143) 4.233 328 $ 26 See Notes to Consolidated Financial Statements. GU February 1, 2020 February 2, 2019 $ 1,541 $ olidated Statements of Cash Flows sin millions Fiscal Years Ended Operating activities January 30, 2021 Net earnings Adjustments to reconcile net earnings to total cash provided by operating activities 1,798 Depreciation and amortization Restructuring charges Stock-based compensation Deferred Income taxes Other, not Changes in operating assets and liabilities, net of acquired assets and liabilities: Receivables Merchandise Inventories (435) Other assets Accounts payablo 1,676 Income taxes Other liabilities Total cash provided by operating activities 4,927 Investing activities Additions to property and equipment, net of $32, 510 and $53, respectively, of non-cash capital expenditures (713) Purchases of investments (620) Sales of investments Acquisitions, net of cash acquired Other, net Total cash provided by (used in) Investing activities (788) Financing activities Repurchase of common stock (312) Issuance of common stock Dividends paid (568) Borrowings of debt 1,892 Repayments of debt (1,916) Other, net (876) Total cash used in financing activities 7 Effect of exchange rate changes on cash Increase in cash, cash equivalents and restricted cash 2.355 Cash, cash equivalents and restricted cash at beginning of period 5,625 Cash, cash equivalents and restricted cash at end of period SIBE" Rgek 925 68**CU: BEATI *{'be 28998 LEINGE T'E & *{179 EUR* (1,003) (1.498) 3.270 $ $ Supplerental cash flow information Income taxes pald Interest paid 442 50 $ $ 514 62 $ See Notes to Consolidated Financial Statements. Requirements 1. Prepare comparative 2020 balance sheet in good form) for the company. Round all percents to tenths (0.0%). Prepare a common-size income statement (see textbook for example). Prepare a trend analysis using the income statement for three years 2. Compute the ratios listed on the following page. Compare with with industry averages (readyratios.com/sec) State your answers in correct format with proper labels and rounding as shown in the textbook, i.e., turnover-3.4 times, Days' sales-42 days, profit margin-8.3%, etc. Consolidated Statements of Earnings S and shares in milions, except per share amounts Fiscal Years Ended Revenue Cost of sales Gross profit Selling general and administrative expenses Restructuring charges Operating income Other Income (ponse): Gain on sale of Investments Investment income and other Interest expenso Eamingo before income tax expense Income tax expense Not earnings January 30, 2021 47,262 36.689 10,573 7,928 254 2,391 February 1, 2020 43,638 33.590 10,048 7.998 41 2,009 February 2, 2019 $ 42,879 32.918 9.961 8,015 46 1,900 1 37 (52) 2,377 579 1.799 1 47 (64) 1,993 452 1,541 12 49 (13) 1,888 424 1.464 5.30 6.93 8.84 $ $ 5.82 5.75 $ s 5.20 Basic earrings por share Diluted earnings per share Weighted average common shares outstanding Basic Diluted 259.6 263.0 2849 268.1 278.4 281.4 See Notes to Consolidated Financial Statements. "Os RA 42,879 nsolidated Balance Sheets $ and shares in millions, except per share amounts January 30, 2021 February 1, 2020 $ 2229 1,149 5494 1,061 5,812 373 12,540 5.174 305 8,857 Assets Current assets Cash and cash equivalents Receivables, net Merchandise Inventories Other current assets Total current assets Property and equipment Land and buildings Leasehold improvements Fixtures and equipment Property under finance leases Gross property and equipment Less accumulated depreciation Net property and equipment Operating lease assets Goodwill Other assets Total assets 858 2,192 6,333 73 9,256 6,996 2.260 2,612 988 669 19,067 650 2,203 6.288 89 9.228 6,900 2,328 2.709 984 713 15.591 6,979 317 711 5.286 281 501 410 906 Llabilities and equity Current liabilities Accounts payable Unredeemed gift card liabilities Deferred revenue Accrued compensation and related expenses Accrued kablities Short-term debt Current portion of operating lease liabilities Current portion of long-term debt Total current liabilities Long-term operating lease llabilities Long-term liabilities Long-term debt Contingencies and commitments (Note 13) Equity Best Buy Co., Inc. Shareholders' Equity Preferred stock, $1.00 par value: Authorized - 400,000 shares; Issued and outstanding - none Common stock, SO.10 par value: Authorized - 1.0 billion shares; Issued and outstanding - 257 and 256 shares, respectively Additional pald-In capital Retained earnings Accumulated other comprehensive Income Total eqully Total liabilities and equity 725 972 110 693 14 10,521 2,012 694 1.253 680 14 8,060 2.138 657 1.257 26 26 4,233 328 4,587 19,067 3.158 205 3,479 15,591 $ See Notes to Consolidated Financial Statements. Consolidated Statements of Changes in Shareholders' Equity S and shares in millions, except per share amounts Common Shares 283 Common Stock 28 Additional Pald-In Capital Ratainod Earnings 3,270 73 1,464 Accumulated Other Comprehensive Income (Loss) 314 $ Total Equity 3,612 73 1,464 (20) 123 38 6 (167) (20) 123 38 (491) (1.493) 3,306 (22) 1,541 (21) 266 (497) (1,325) 2,985 (22) 1,541 (1) 27 294 Balances as of February 3, 2018 Adoption of ASU 2014-09 Net camings Other comprehensive loss: Foreign currency translation adjustments, net of tax Stock-based compensation Issuance of common stock Common stock dividends, $1.80 per share Repurchase of common stock Balances as of February 2, 2019 Adoption of ASU 2016-02 Net earnings Other comprehensive Income: Foreign currency translation adjustments. net of tax Stock-based compensation Issuance of common stock Common stock dividends, $2.00 per share Repurchase of common stock Other Balances as of February 1, 2020 Net earnings Other comprehensive income (loss): Foreign currency translation adjustments, net of tax Cash flow hedges Reclassification of cumulative translation adjustments into earnings due to exit of business Stock-based compensation Issuance of common stock Common stock dividends, $2.20 per share Repurchase of common stock Balances as of January 30, 2021 143 48 9 (198) (2) (536) (810) 1 143 48 (527) (1,009) (2) 3,479 1.798 (14) (1) 256 26 295 3,158 1.798 (4) (2) (4) (2) 39 135 28 12 (175) 39 135 28 (568) (318) 4,587 (3) 257 (580) (143) 4.233 328 $ 26 See Notes to Consolidated Financial Statements. GU February 1, 2020 February 2, 2019 $ 1,541 $ olidated Statements of Cash Flows sin millions Fiscal Years Ended Operating activities January 30, 2021 Net earnings Adjustments to reconcile net earnings to total cash provided by operating activities 1,798 Depreciation and amortization Restructuring charges Stock-based compensation Deferred Income taxes Other, not Changes in operating assets and liabilities, net of acquired assets and liabilities: Receivables Merchandise Inventories (435) Other assets Accounts payablo 1,676 Income taxes Other liabilities Total cash provided by operating activities 4,927 Investing activities Additions to property and equipment, net of $32, 510 and $53, respectively, of non-cash capital expenditures (713) Purchases of investments (620) Sales of investments Acquisitions, net of cash acquired Other, net Total cash provided by (used in) Investing activities (788) Financing activities Repurchase of common stock (312) Issuance of common stock Dividends paid (568) Borrowings of debt 1,892 Repayments of debt (1,916) Other, net (876) Total cash used in financing activities 7 Effect of exchange rate changes on cash Increase in cash, cash equivalents and restricted cash 2.355 Cash, cash equivalents and restricted cash at beginning of period 5,625 Cash, cash equivalents and restricted cash at end of period SIBE" Rgek 925 68**CU: BEATI *{'be 28998 LEINGE T'E & *{179 EUR* (1,003) (1.498) 3.270 $ $ Supplerental cash flow information Income taxes pald Interest paid 442 50 $ $ 514 62 $ See Notes to Consolidated Financial Statements Step by Step Solution
There are 3 Steps involved in it
Step: 1

Get Instant Access to Expert-Tailored Solutions
See step-by-step solutions with expert insights and AI powered tools for academic success
Step: 2

Step: 3
Ace Your Homework with AI
Get the answers you need in no time with our AI-driven, step-by-step assistance
Get Started
Telecom Audit
Authors: M S. Mastel
1st Edition
0071410546, 9780071410540