Answered step by step
Verified Expert Solution
Question
1 Approved Answer
Data from the Environmental Protection Agency website for Ogden-Clearfield is provided below for the two pollutants Ozone and NO2. The data is for the year
Data from the Environmental Protection Agency website for Ogden-Clearfield is provided below for the two pollutants Ozone and NO2. The data is for the year 2019 and each data point is the maximum value for that pollutant for that particular month.
| Month | Ozone | NO2 |
| Jan | 45 | 42 |
| Feb | 80 | 48 |
| Mar | 38 | 45 |
| Apr | 28 | 64 |
| May | 25 | 84 |
| June | 25 | 84 |
| July | 29 | 143 |
| Aug | 35 | 147 |
| Sept | 40 | 87 |
| Oct | 39 | 74 |
| Nov | 42 | 39 |
| Dec | 47 | 33 |
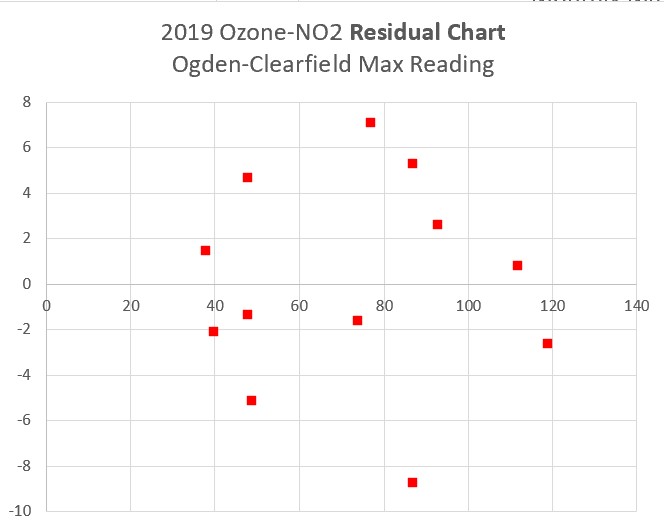
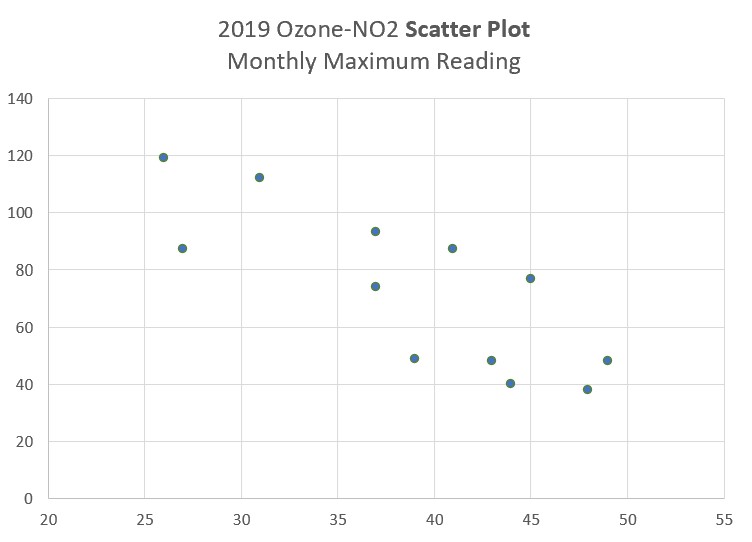
Below are the scatter plot and residual plot for this dataset.


Step by Step Solution
There are 3 Steps involved in it
Step: 1

Get Instant Access to Expert-Tailored Solutions
See step-by-step solutions with expert insights and AI powered tools for academic success
Step: 2

Step: 3

Ace Your Homework with AI
Get the answers you need in no time with our AI-driven, step-by-step assistance
Get Started


