Question
Data has come in from the collection effort. Like many initiatives carried out in business, the data provided to your team came from another department
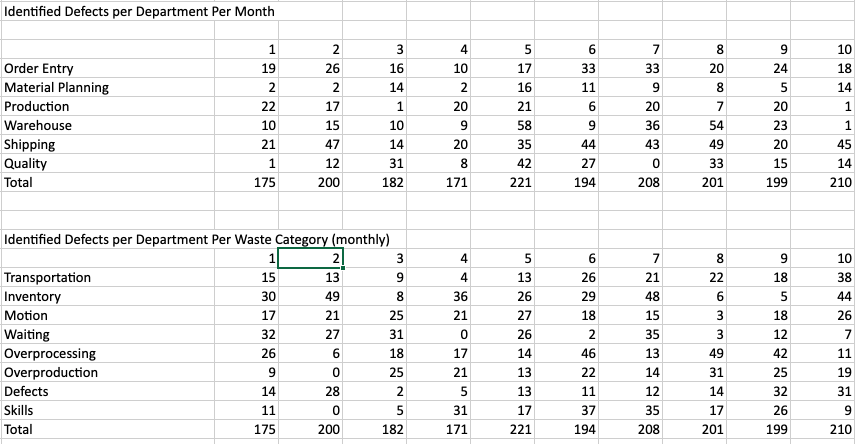
Data has come in from the collection effort. Like many initiatives carried out in business, the data provided to your team came from another department associated with the strategic planning arm of the company, using data collected externally as well as mined internally. The data is not exactly what your team had intended to collect, but given time constraints and budgets, your boss who assigned the research has asked you to do what you can with the available data and seek to answer management and research questions as best as you can. Conduct a team brainstorming session to review the data. Then, carry out the following activities and answer the associated questions:
- Use descriptive statistics on the data set to gain an understanding of the ?big picture? of the data.
- Include in your analysis any descriptive statistics that, in your view, characterize the data such as:
- Measures of central tendency (mean, median, mode, or all as appropriate)
- Measure of variance (Standard deviation)
- Plots: Is the data normal? Other, such as skewed or ranked?
- Trends, outliers, or other areas of interest (plot as necessary)
- What is interesting or informative about this data?
- To what extent could this data answer the research questions we have developed? What other questions would this data enable us to answer?


Identified Defects per Department Per Month Order Entry Material Planning Production Warehouse Shipping Quality Total Transportation Inventory Motion Waiting Overprocessing Overproduction 1 19 2 22 10 21 Defects Skills Total 1 175 2 26 2 17 15 47 12 200 3 16 2 13 49 21 27 6 0 28 0 200 Identified Defects per Department Per Waste Category (monthly) 1 15 30 17 32 26 9 14 11 175 HE 14 1 1438 10 182 3 69 8 25 31 18 25 2 5 182 4 10 2092 8 171 4 36 21 0 17 21 5 31 171 5 17 16 21 58 35 42 221 S3678HES 5 13 26 27 26 14 13 13 17 221 6 33 11 6 9 44 27 194 6 26 29 18 2 46 22 11 37 194 7 33 9 20 36 43 0 208 7 21 48 15 35 13 14 12 35 208 8287 20 54 49 33 201 26339 8 22 49 31 14 17 201 9 24 5 20 23 20 15 199 9 18 5 18 12 42 25 32 26 199 10 18 14 1 1 45 14 210 10 38 44 26 7 11 19 31 9 210
Step by Step Solution
3.39 Rating (146 Votes )
There are 3 Steps involved in it
Step: 1
To gain an understanding of the big picture of the data we can perform descriptive statistics and analyze the provided information Lets start by organizing and summarizing the data Measures of Central ...
Get Instant Access to Expert-Tailored Solutions
See step-by-step solutions with expert insights and AI powered tools for academic success
Step: 2

Step: 3

Ace Your Homework with AI
Get the answers you need in no time with our AI-driven, step-by-step assistance
Get Started


