Answered step by step
Verified Expert Solution
Question
1 Approved Answer
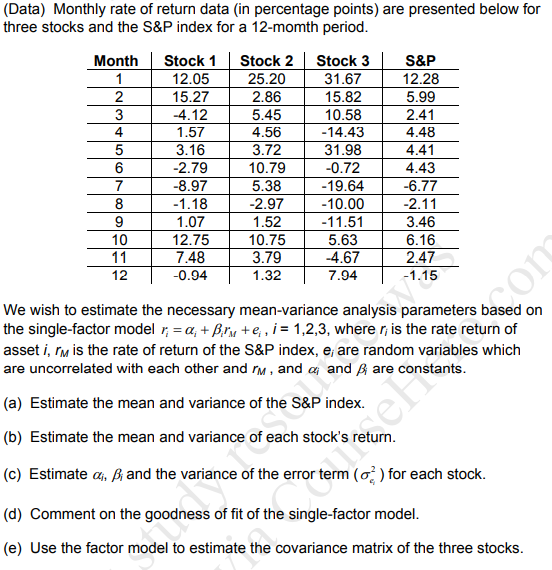
(Data) Monthly rate of return data (in percentage points) are presented below for three stocks and the S&P index for a 12-momth period. Month

(Data) Monthly rate of return data (in percentage points) are presented below for three stocks and the S&P index for a 12-momth period. Month 1 2 3 4 5 6 7 8 9 10 11 12 Stock 1 12.05 15.27 -4.12 1.57 3.16 -2.79 -8.97 -1.18 1.07 12.75 7.48 -0.94 Stock 2 25.20 2.86 5.45 4.56 3.72 10.79 5.38 -2.97 1.52 10.75 3.79 1.32 Stock 3 31.67 15.82 10.58 -14.43 31.98 -0.72 -19.64 -10.00 -11.51 5.63 -4.67 7.94 S&P 12.28 5.99 2.41 4.48 4.41 4.43 -6.77 -2.11 3.46 6.16 2.47 -1.15 om We wish to estimate the necessary mean-variance analysis paran parameters based on the single-factor model r = a + Bir + e,i = 1,2,3, where r, is the rate return of asset i, M is the rate of return of the S&P index, e, are random variables which are uncorrelated with each other and , and a; and are constants. (a) Estimate the mean and variance of the S&P index. (b) Estimate the mean and variance of each stock's return. (c) Estimate a, B; and the variance of the error term (o) for each stock. (d) Comment on the goodness of fit of the single-factor model. (e) Use the factor model to estimate the covariance matrix of the three stocks.
Step by Step Solution
★★★★★
3.35 Rating (161 Votes )
There are 3 Steps involved in it
Step: 1
Certainly Based on the given monthly rate of return data for the SP index and three stocks we can calculate the mean and variance for each asset Here ...
Get Instant Access to Expert-Tailored Solutions
See step-by-step solutions with expert insights and AI powered tools for academic success
Step: 2

Step: 3

Ace Your Homework with AI
Get the answers you need in no time with our AI-driven, step-by-step assistance
Get Started


