

Answered step by step
Verified Expert Solution
Question
1 Approved Answer
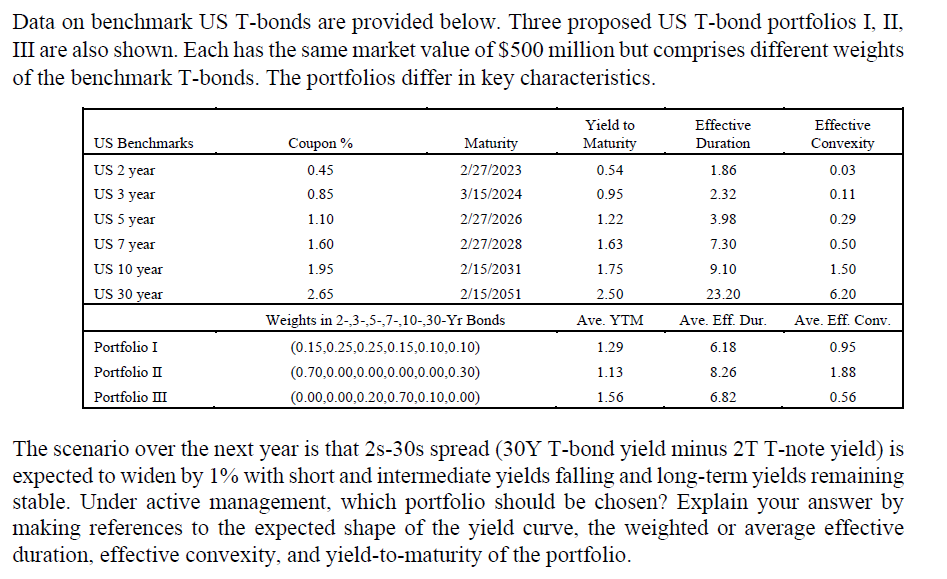
Data on benchmark US T-bonds are provided below. Three proposed US T-bond portfolios I, II, III are also shown. Each has the same market value
Step by Step Solution
There are 3 Steps involved in it
Step: 1

Get Instant Access to Expert-Tailored Solutions
See step-by-step solutions with expert insights and AI powered tools for academic success
Step: 2

Step: 3
Ace Your Homework with AI
Get the answers you need in no time with our AI-driven, step-by-step assistance
Get Started
The Private Equity Edge How Private Equity Players And The Worlds Top Companies Build Value And Wealth
Authors: Arthur B. Laffer,William J. Hass, Shepherd G. Pryor
1st Edition
0071590781,0071642927