Data on Scholastic Aptitude Test (SAT) scores are published by the College Entrance Examination Board in National College-Bound Senior. SAT scores for randomly selected

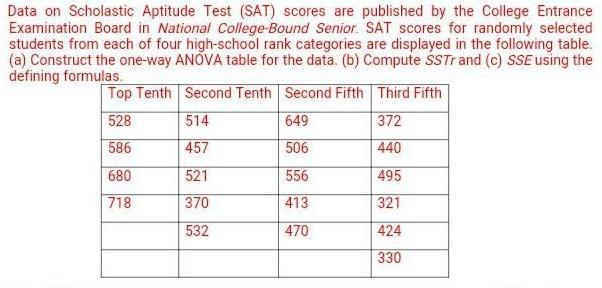
Data on Scholastic Aptitude Test (SAT) scores are published by the College Entrance Examination Board in National College-Bound Senior. SAT scores for randomly selected students from each of four high-school rank categories are displayed in the following table. (a) Construct the one-way ANOVA table for the data. (b) Compute SSTr and (c) SSE using the defining formulas. Top Tenth Second Tenth Second Fifth Third Fifth 528 514 649 372 586 457 506 440 680 521 556 495 718 370 413 321 532 470 424 330
Step by Step Solution
There are 3 Steps involved in it
Step: 1
It appears you have a table of SAT scores for randomly selected students from different highschool rank categories If you need to calculate the sample ...
See step-by-step solutions with expert insights and AI powered tools for academic success
Step: 2

Step: 3

Ace Your Homework with AI
Get the answers you need in no time with our AI-driven, step-by-step assistance
Get Started


