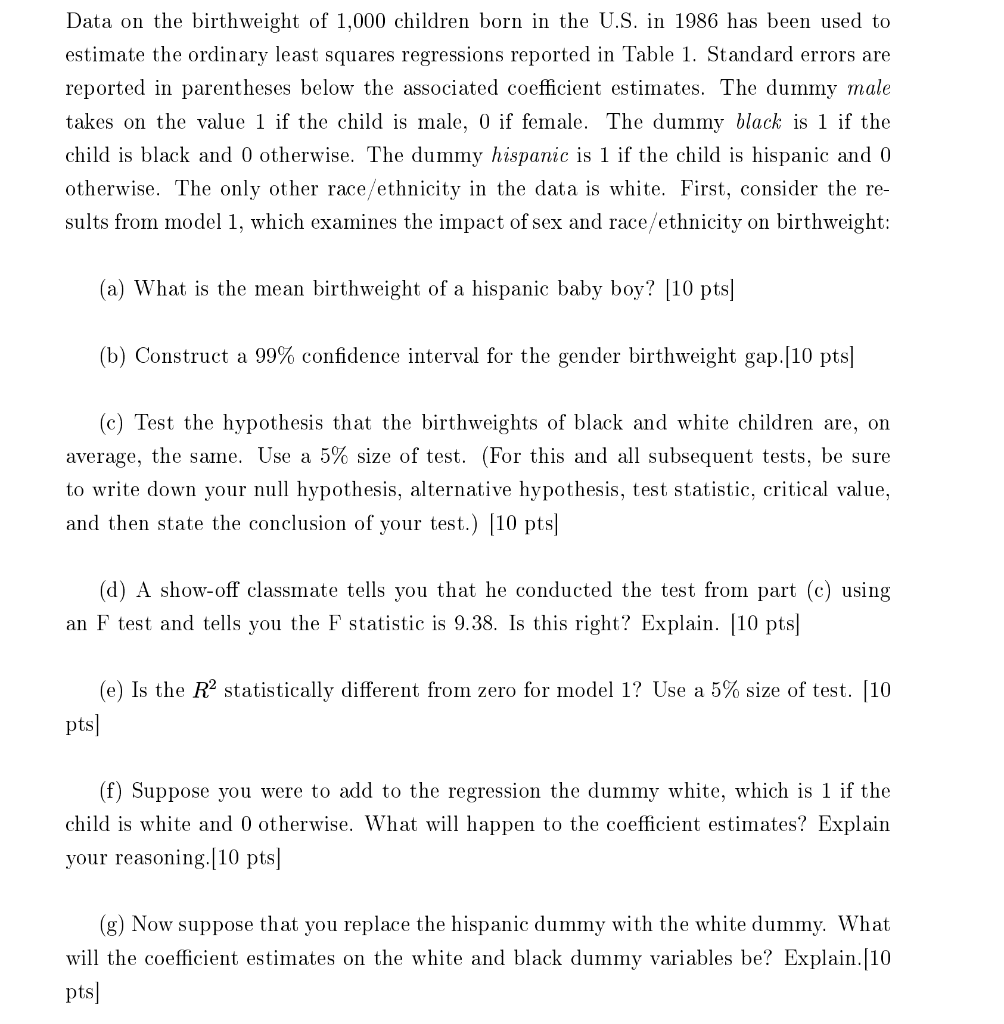
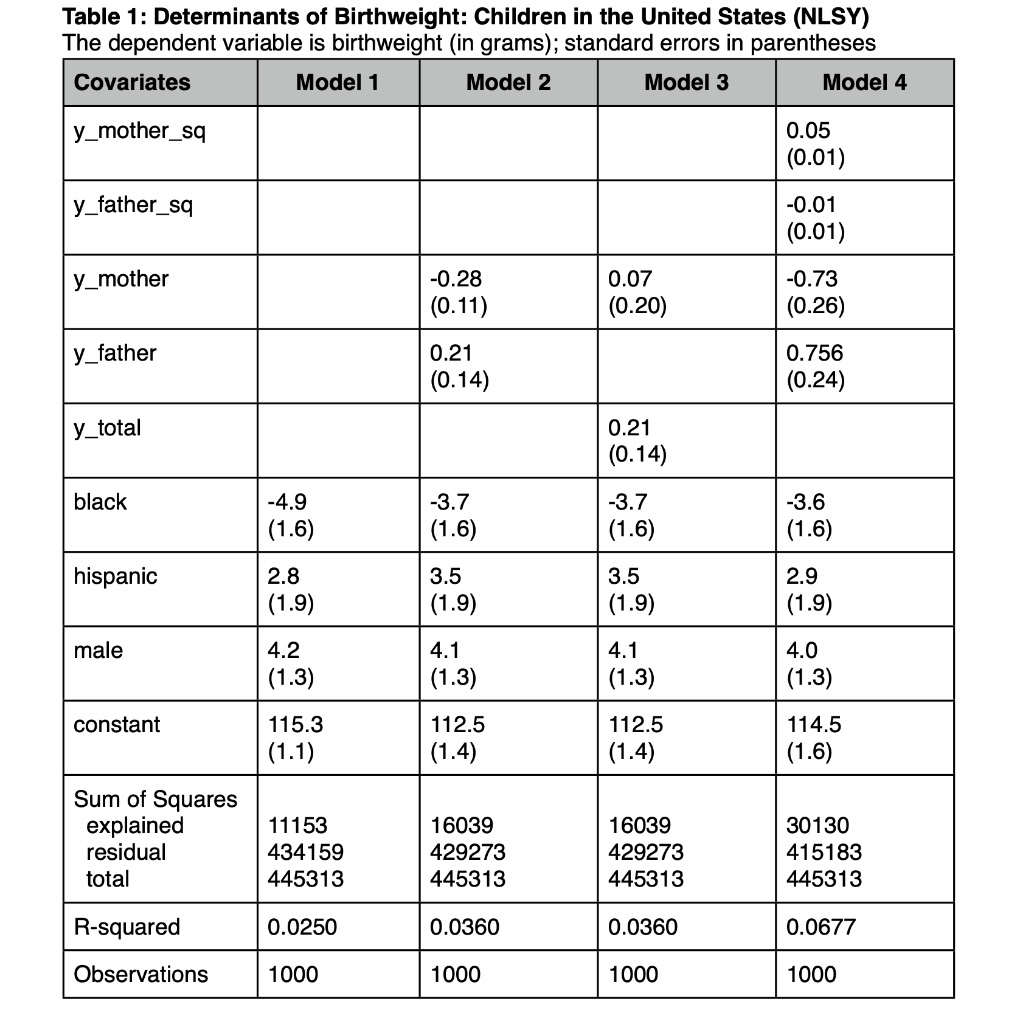
Data on the birth weight of 1,000 children born in the U.S. in 1986 has been used to estimate the ordinary least squares regressions reported in Table 1. Standard errors are reported in parentheses below the associated coefficient estimates. The dummy male takes on the value 1 if the child is male, 0 if female. The dummy black is 1 if the child is black and 0 otherwise. The dummy hispanic is 1 if the child is hispanic and 0 otherwise. The only other race/ethnicity in the data is white. First, consider the re- sults from model 1, which examines the impact of sex and race/ethnicity on birthweight: (a) What is the mean birthweight of a hispanic baby boy? [10 pts] (b) Construct a 99% confidence interval for the gender birthweight gap.[10 pts] (C) Test the hypothesis that the birthweights of black and white children are, on average, the same. Use a 5% size of test. (For this and all subsequent tests, be sure to write down your null hypothesis, alternative hypothesis, test statistic, critical value, and then state the conclusion of your test.) (10 pts] (d) A show-off classmate tells you that he conducted the test from part (c) using an F test and tells you the F statistic is 9.38. Is this right? Explain. [10 pts] (e) Is the R2 statistically different from zero for model 1? Use a 5% size of test. [10 pts] (f) Suppose you were to add to the regression the dummy white, which is 1 if the child is white and 0 otherwise. What will happen to the coefficient estimates? Explain your reasoning.[10 pts] (8) Now suppose that you replace the hispanic dummy with the white dummy. What will the coefficient estimates on the white and black dummy variables be? Explain.[10 pts] Table 1: Determinants of Birthweight: Children in the United States (NLSY) The dependent variable is birthweight (in grams); standard errors in parentheses Covariates Model 1 Model 2 Model 3 Model 4 y_mother_sq 0.05 (0.01) y_father_sq -0.01 (0.01) y_ _mother -0.28 (0.11) 0.07 (0.20) -0.73 (0.26) y_father 0.21 (0.14) 0.756 (0.24) y_total 0.21 (0.14) black -4.9 (1.6) -3.7 (1.6) -3.7 (1.6) -3.6 (1.6) hispanic 2.8 (1.9) 3.5 (1.9) 3.5 (1.9) 2.9 (1.9) male 4.2 (1.3) 4.1 (1.3) 4.1 (1.3) 4.0 (1.3) constant 115.3 (1.1) 112.5 (1.4) 112.5 (1.4) 114.5 (1.6) Sum of Squares explained residual total 11153 434159 445313 16039 429273 445313 16039 429273 445313 30130 415183 445313 R-squared 0.0250 0.0360 0.0360 0.0677 Observations 1000 1000 1000 1000 Data on the birth weight of 1,000 children born in the U.S. in 1986 has been used to estimate the ordinary least squares regressions reported in Table 1. Standard errors are reported in parentheses below the associated coefficient estimates. The dummy male takes on the value 1 if the child is male, 0 if female. The dummy black is 1 if the child is black and 0 otherwise. The dummy hispanic is 1 if the child is hispanic and 0 otherwise. The only other race/ethnicity in the data is white. First, consider the re- sults from model 1, which examines the impact of sex and race/ethnicity on birthweight: (a) What is the mean birthweight of a hispanic baby boy? [10 pts] (b) Construct a 99% confidence interval for the gender birthweight gap.[10 pts] (C) Test the hypothesis that the birthweights of black and white children are, on average, the same. Use a 5% size of test. (For this and all subsequent tests, be sure to write down your null hypothesis, alternative hypothesis, test statistic, critical value, and then state the conclusion of your test.) (10 pts] (d) A show-off classmate tells you that he conducted the test from part (c) using an F test and tells you the F statistic is 9.38. Is this right? Explain. [10 pts] (e) Is the R2 statistically different from zero for model 1? Use a 5% size of test. [10 pts] (f) Suppose you were to add to the regression the dummy white, which is 1 if the child is white and 0 otherwise. What will happen to the coefficient estimates? Explain your reasoning.[10 pts] (8) Now suppose that you replace the hispanic dummy with the white dummy. What will the coefficient estimates on the white and black dummy variables be? Explain.[10 pts] Table 1: Determinants of Birthweight: Children in the United States (NLSY) The dependent variable is birthweight (in grams); standard errors in parentheses Covariates Model 1 Model 2 Model 3 Model 4 y_mother_sq 0.05 (0.01) y_father_sq -0.01 (0.01) y_ _mother -0.28 (0.11) 0.07 (0.20) -0.73 (0.26) y_father 0.21 (0.14) 0.756 (0.24) y_total 0.21 (0.14) black -4.9 (1.6) -3.7 (1.6) -3.7 (1.6) -3.6 (1.6) hispanic 2.8 (1.9) 3.5 (1.9) 3.5 (1.9) 2.9 (1.9) male 4.2 (1.3) 4.1 (1.3) 4.1 (1.3) 4.0 (1.3) constant 115.3 (1.1) 112.5 (1.4) 112.5 (1.4) 114.5 (1.6) Sum of Squares explained residual total 11153 434159 445313 16039 429273 445313 16039 429273 445313 30130 415183 445313 R-squared 0.0250 0.0360 0.0360 0.0677 Observations 1000 1000 1000 1000