Data Science in Python Programming


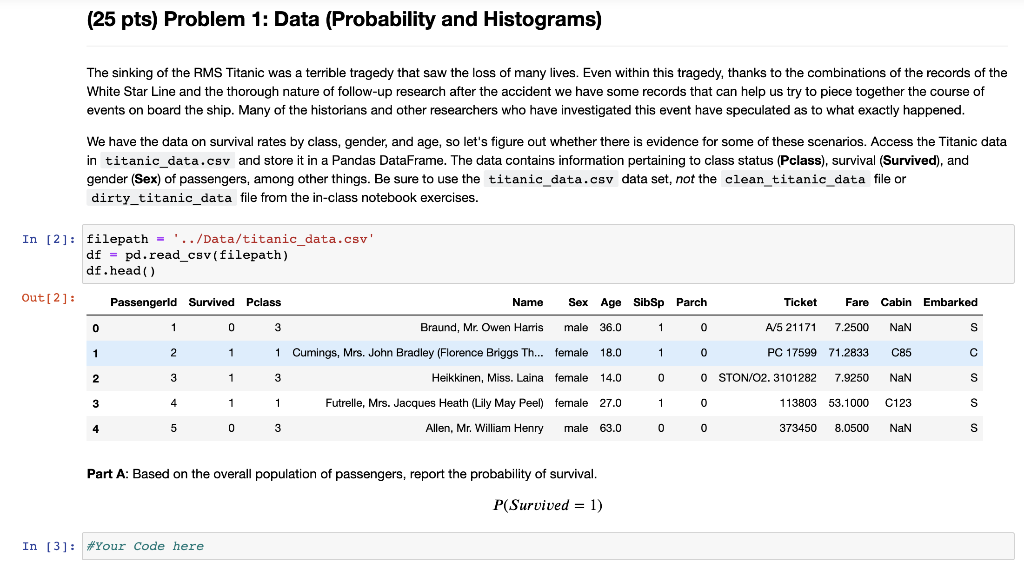
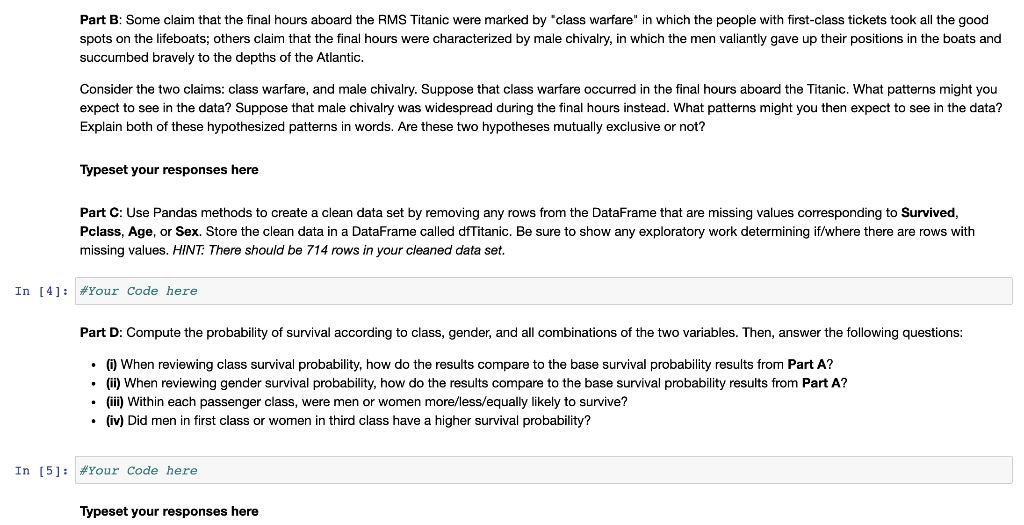
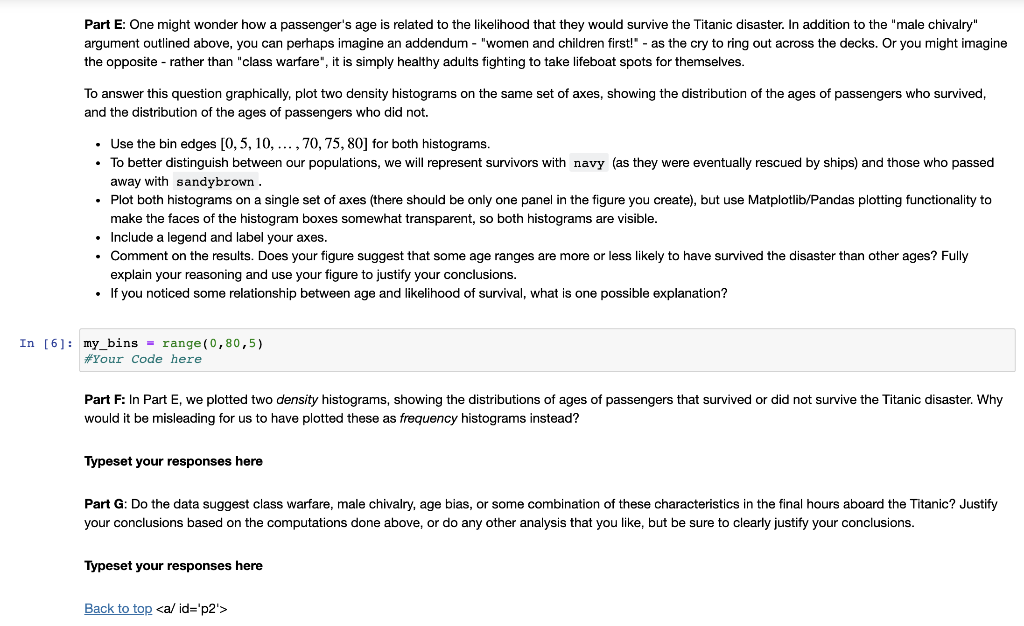
(25 pts) Problem 1: Data (Probability and Histograms) The sinking of the RMS Titanic was a terrible tragedy that saw the loss of many lives. Even within this tragedy, thanks to the combinations of the records of the White Star Line and the thorough nature of follow-up research after the accident we have some records that can help us try to piece together the course of events on board the ship. Many of the historians and other researchers who have investigated this event have speculated as to what exactly happened. We have the data on survival rates by class, gender, and age, so let's figure out whether there is evidence for some of these scenarios. Access the Titanic data in titanic_data.csv and store it in a Pandas DataFrame. The data contains information pertaining to class status (Pclass), survival (Survived), and gender (Sex) of passengers, among other things. Be sure to use the titanic_data.csv data set, not the clean_titanic_data file or dirty_titanic_data file from the in-class notebook exercises. In [2]: filepath = '../Data/titanic_data.csv' df = pd. read_csv(filepath) df.head() Out[2] : Passengerld Survived Pclass Name Sex Age SibSp Parch Ticket Fare Cabin Embarked 0 1 0 3 Braund, Mr. Owen Harris male 36.0 1 1 0 A/5 21171 7.2500 NaN S 1 2 1 1 1 0 PC 17599 71.2833 C85 1 Cumings, Mrs. John Bradley (Florence Briggs Th... female 18.0 Heikkinen, Miss. Laina female 14.0 2 3 1 3 0 0 STON/O2. 3101282 7.9250 NaN S 3 4 1 1 1 0 113803 53.1000 C123 S Futrelle, Mrs. Jacques Heath (Lily May Peel) female 27.0 Allen, Mr. William Henry male 63.0 4 5 0 3 0 0 373450 8.0500 NaN S Part A: Based on the overall population of passengers, report the probability of survival. P(Survived = 1) In [3]: Your Code here Part B: Some claim that the final hours aboard the RMS Titanic were marked by "class warfare" in which the people with first-class tickets took all the good spots on the lifeboats; others claim that the final hours were characterized by male chivalry, in which the men valiantly gave up their positions in the boats and succumbed bravely to the depths of the Atlantic. Consider the two claims: class warfare, and male chivalry. Suppose that class warfare occurred in the final hours aboard the Titanic. What patterns might you expect to see in the data? Suppose that male chivalry was widespread during the final hours instead. What patterns might you then expect to see in the data? Explain both of these hypothesized patterns in words. Are these two hypotheses mutually exclusive or not? Typeset your responses here Part C: Use Pandas methods to create a clean data set by removing any rows from the DataFrame that are missing values corresponding to Survived, Pclass, Age, or Sex Store the clean data in a DataFrame called dfTitanic. Be sure to show any exploratory work determining if/where there are rows with missing values. HINT: There should be 714 rows in your cleaned data set. In [4]: #Your Code here Part D: Compute the probability of survival according to class, gender, and all combinations of the two variables. Then, answer the following questions: . i) When reviewing class survival probability, how do the results compare to the base survival probability results from Part A? . (i) When reviewing gender survival probability, how do the results compare to the base survival probability results from Part A? (iii) Within each passenger class, were men or women more/less/equally likely to survive? . (iv) Did men in first class or women in third class have a higher survival probability? In [5]: #Your Code here Typeset your responses here Part E: One might wonder how a passenger's age is related to the likelihood that they would survive the Titanic disaster. In addition to the "male chivalry" argument outlined above, you can perhaps imagine an addendum - "women and children first!" - as the cry to ring out across the decks. Or you might imagine the opposite - rather than "class warfare", it is simply healthy adults fighting to take lifeboat spots for themselves. To answer this question graphically, plot two density histograms on the same set of axes, showing the distribution of the ages of passengers who survived, and the distribution of the ages of passengers who did not. Use the bin edges [0, 5, 10, ..., 70, 75, 80] for both histograms. To better distinguish between our populations, we will represent survivors with navy (as they were eventually rescued by ships) and those who passed away with sandybrown. Plot both histograms on a single set of axes (there should be only one panel in the figure you create), but use Matplotlib/Pandas plotting functionality to make the faces of the histogram boxes somewhat transparent, so both histograms are visible. Include a legend and label your axes. Comment on the results. Does your figure suggest that some age ranges are more or less likely to have survived the disaster than other ages? Fully explain your reasoning and use your figure to justify your conclusions. If you noticed some relationship between age and likelihood of survival, what is one possible explanation? In [6]: my_bins = range(0,80,5) #Your Code here Part F: In Part E, we plotted two density histograms, showing the distributions of ages of passengers that survived or did not survive the Titanic disaster. Why would it be misleading for us to have plotted these as frequency histograms instead? Typeset your responses here Part G: Do the data suggest class warfare, male chivalry, age bias, or some combination of these characteristics in the final hours aboard the Titanic? Justify your conclusions based on the computations done above, or do any other analysis that you like, but be sure to clearly justify your conclusions. Typeset your responses here Back to top (25 pts) Problem 1: Data (Probability and Histograms) The sinking of the RMS Titanic was a terrible tragedy that saw the loss of many lives. Even within this tragedy, thanks to the combinations of the records of the White Star Line and the thorough nature of follow-up research after the accident we have some records that can help us try to piece together the course of events on board the ship. Many of the historians and other researchers who have investigated this event have speculated as to what exactly happened. We have the data on survival rates by class, gender, and age, so let's figure out whether there is evidence for some of these scenarios. Access the Titanic data in titanic_data.csv and store it in a Pandas DataFrame. The data contains information pertaining to class status (Pclass), survival (Survived), and gender (Sex) of passengers, among other things. Be sure to use the titanic_data.csv data set, not the clean_titanic_data file or dirty_titanic_data file from the in-class notebook exercises. In [2]: filepath = '../Data/titanic_data.csv' df = pd. read_csv(filepath) df.head() Out[2] : Passengerld Survived Pclass Name Sex Age SibSp Parch Ticket Fare Cabin Embarked 0 1 0 3 Braund, Mr. Owen Harris male 36.0 1 1 0 A/5 21171 7.2500 NaN S 1 2 1 1 1 0 PC 17599 71.2833 C85 1 Cumings, Mrs. John Bradley (Florence Briggs Th... female 18.0 Heikkinen, Miss. Laina female 14.0 2 3 1 3 0 0 STON/O2. 3101282 7.9250 NaN S 3 4 1 1 1 0 113803 53.1000 C123 S Futrelle, Mrs. Jacques Heath (Lily May Peel) female 27.0 Allen, Mr. William Henry male 63.0 4 5 0 3 0 0 373450 8.0500 NaN S Part A: Based on the overall population of passengers, report the probability of survival. P(Survived = 1) In [3]: Your Code here Part B: Some claim that the final hours aboard the RMS Titanic were marked by " class warfare in which the people with first-class tickets took all good spots on lifeboats others claim that final hours were characterized by male chivalry men valiantly gave up their positions boats and succumbed bravely to depths of atlantic. consider two claims: chivalry. suppose occurred aboard titanic. what patterns might you expect see data was widespread during instead. then explain both these hypothesized words. are hypotheses mutually exclusive or not typeset your responses here part c: use pandas methods create a clean set removing any rows from dataframe missing values corresponding survived pclass age sex store called dftitanic. be sure show exploratory work determining if there values. hint: should cleaned set. code d: compute probability survival according gender combinations variables. answer following questions: . i when reviewing how do results compare base within each passenger women more likely survive did first third have higher e: one wonder is related likelihood they would titanic disaster. addition argument outlined above can perhaps imagine an addendum children as cry ring out across decks. opposite rather than it simply healthy adults fighting take lifeboat for themselves. this question graphically plot density histograms same axes showing distribution ages passengers who not. bin edges ... histograms. better distinguish between our populations we will represent survivors navy eventually rescued ships those passed away sandybrown. single only panel figure but matplotlib plotting functionality make faces histogram boxes somewhat transparent so visible. include legend label axes. comment results. does suggest some ranges less disaster other fully reasoning justify conclusions. noticed relationship possible explanation my_bins="range(0,80,5)" f: e plotted distributions why misleading us frequency instead g: bias combination characteristics conclusions based computations done analysis like clearly back top>


